Fangen Sie an.
Zum Herunterladen scannen
iOS und Android
BitMart / Krypto / AIO

OLAXBT (AIO)

$
$ 0.059 (AIO/USD)
20.00%
24H

OLAXBT Live Kursdaten

Der heutige Preis von OLAXBT ist $ 0.059 (AIO/USD). Mit einer Marktkapitalisierung von $ 13.80M USD. 24-Stunden-Handelsvolumen von $ 5.40M USD, Eine 24-Stunden-Preisänderung von +20.00%, Sowie einer Umlaufmenge von 230.25M AIO.

OLAXBT AIO Preisverlauf USD

Verfolgen Sie den Preis von OLAXBT für heute, 7 Tage, 30 Tage und 90 Tage
Zeitraum
Ändern
Veränderung (%)
Heute
$ 0.0099
20.00%
7Tage
$ 0.0099
25.00%
30Tage
$ 0.049
-50.00%
90Tage
$ 0.049
-50.00%

Besitzen Sie AIO jetzt

Kaufen und verkaufen Sie AIO einfach und sicher auf BitMart.
Jetzt AIO kaufen/verkaufen
Jetzt {0} kaufen/verkaufen
OLAXBT Marktinformationen
Letzter Preis $ 0.059
$ 0.049 24-Std.-Bereich $ 0.059
Allzeithoch
‎$ 0.22‎
Allzeittief
‎$ 0.029‎
24-Std.-Veränderung
‎20.00%‎
Menge 24 Std.
‎$ 5,396,027.66‎
Zirkulierendes Angebot
230.25M AIO
Marktobergrenze
‎$ 13.80M‎
Nettomenge
1.00B AIO
Vollständig verwässerte Marktobergrenze
‎$ 59.93M‎
Handel AIO

Verdienen

Setzen Sie Ihre ungenutzten Kryptowährungen ein und erzielen Sie passives Einkommen durch Ersparnisse, Staking und mehr.
Jetzt versuchen
Jetzt versuchen

OLAXBT X Insight

avatar
Provides a detailed introduction to a day‑trading short‑term strategy that exploits a cryptocurrency's downtrend.

If you trade crypto, and especially looking for scalps/ day trade position, try this method. I made more money that I could imagine using this:

CRYPTO DAY TRADING TUTORIAL: FOLLOW THE TREND (BEARISH Version)

Yesterday I wrote about the bullish version of the follow the trend method, this time let's talk about the bearish version!
This method takes advantage of the follow the trend principle.

My principle:
1. What's falling will keep falling until reversal signs appear.
2. In crypto, the system is "once the momentum fades off, the asset will be abandoned dumping the price for a long period of time". So something that rose hundreds of percent a few days ago could start dropping today and be down 80% by tomorrow (try looking at the LAB few weeks ago, for example).

That's why we take advantage when something's just finished rising, then it looks like it's about to drop, we join in on the slide down.

Step 1: Market Screening.
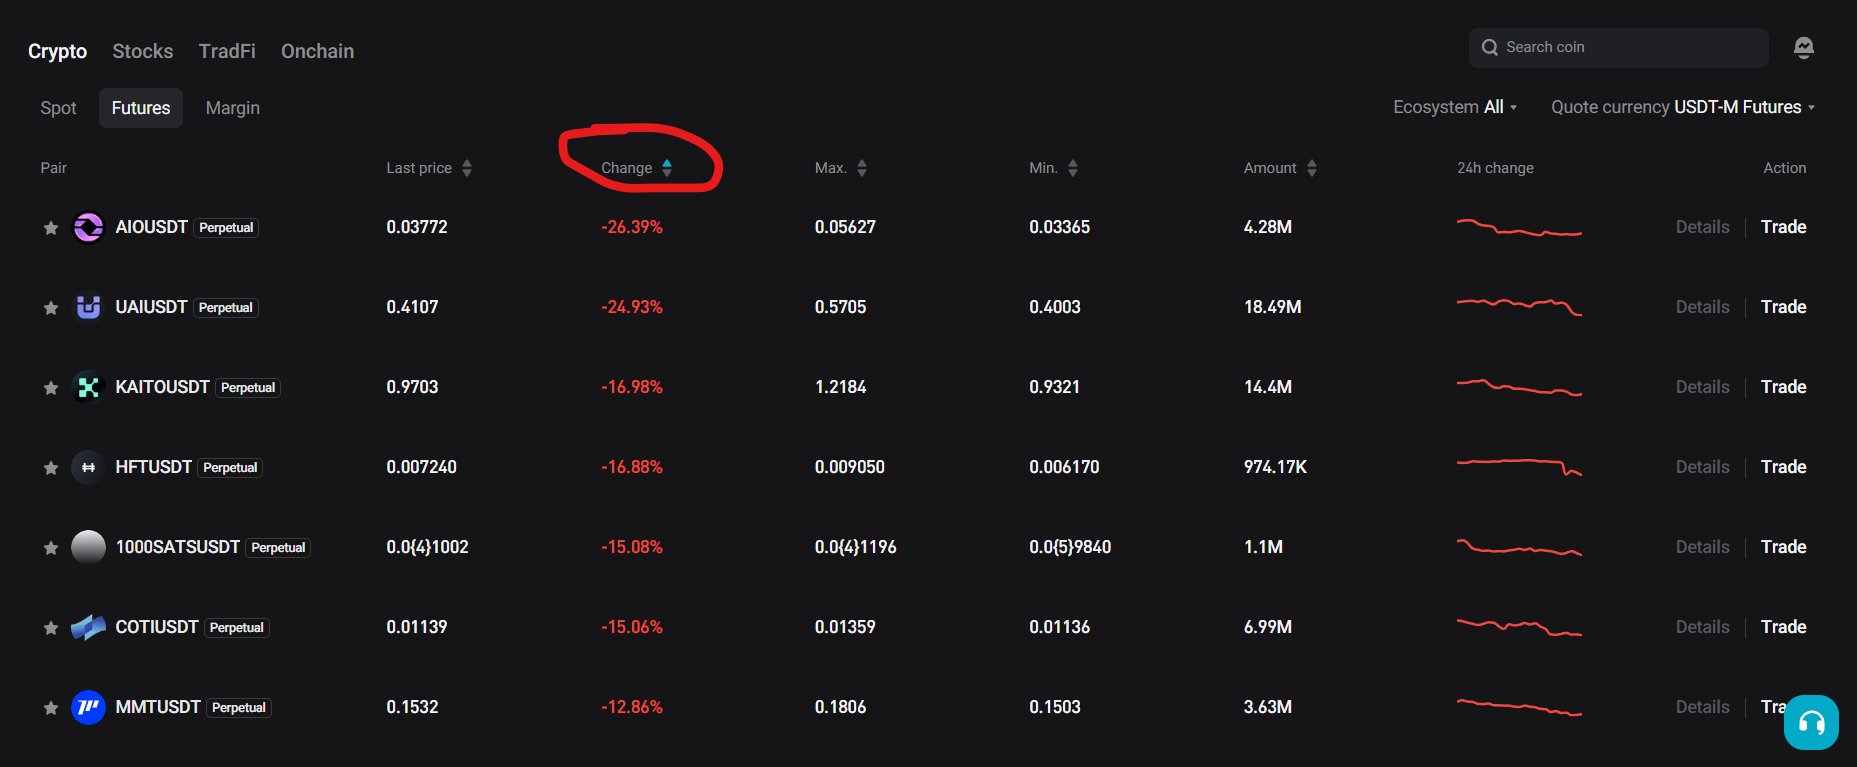
Go to Coinmarketcap, or to your favorite exchange. Sort by 24H% or top losers. Make sure we get the ones with big losses. You can do this by clicking on the 24H% or %Gains depending on the exchange, until it sorts from the lowest (see image 1). Examples in the image include AIO, UAI, KAITO, etc.

Step 2: Confirm the bias is bearish.
Open TradingView (or the exchange you're using, on its chart). Go to the 1‑day or 4‑hour timeframe first. Make sure:
- The chart is bearish (red) and
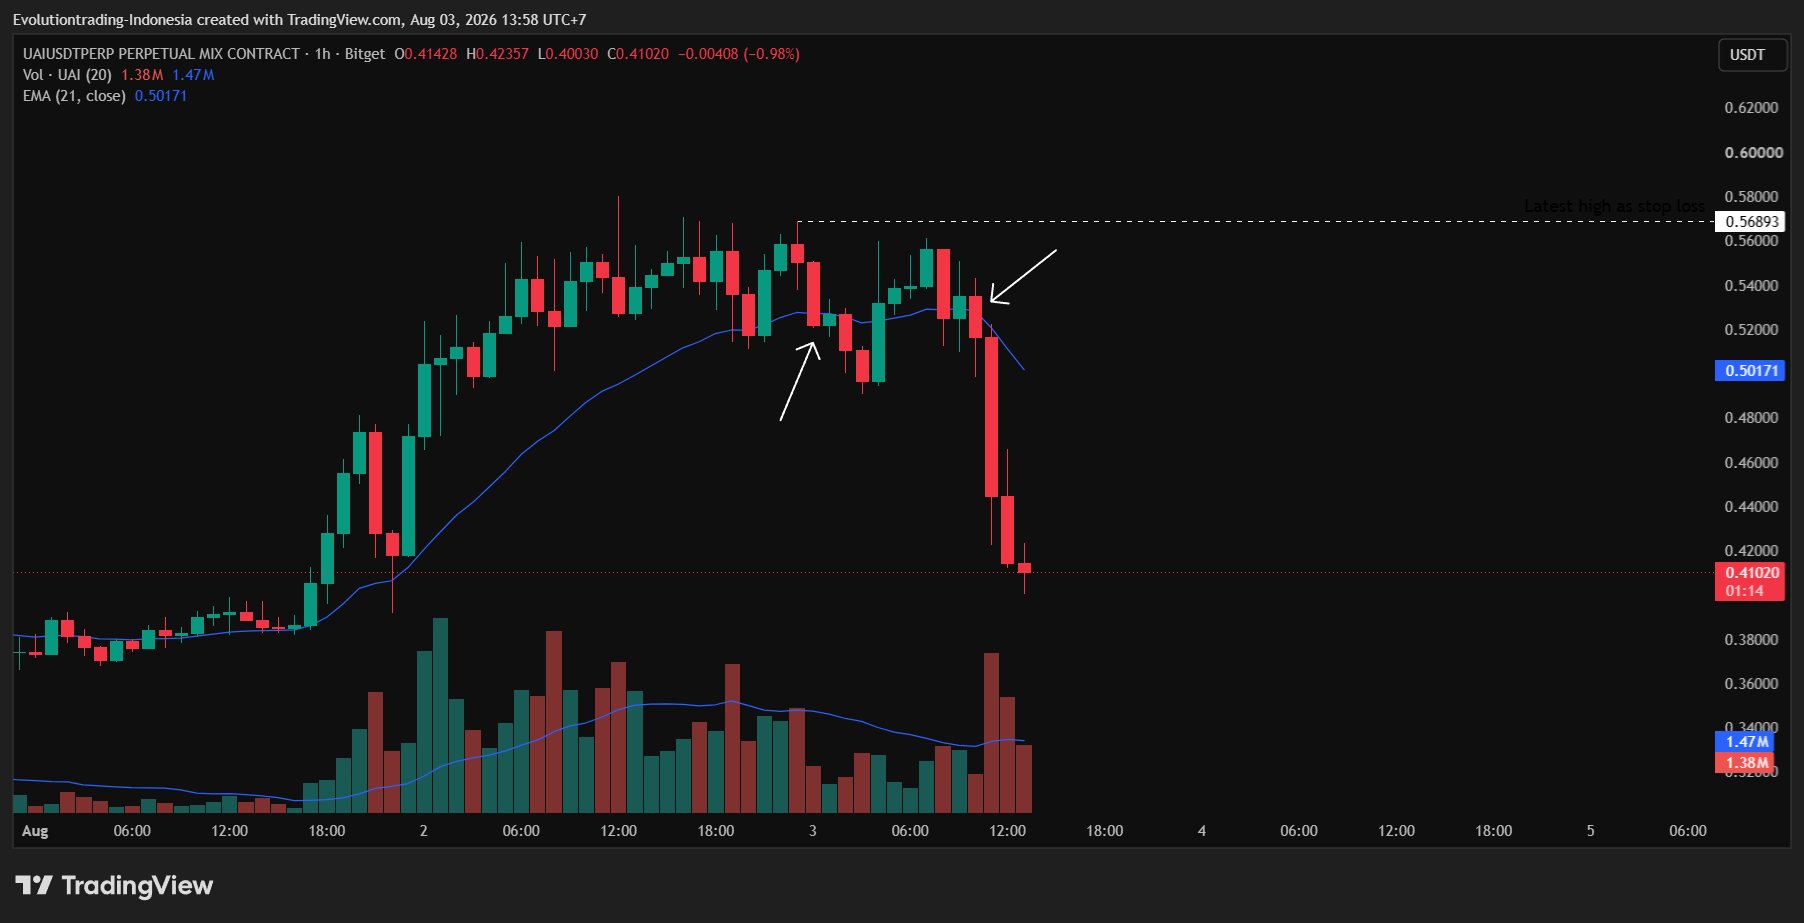
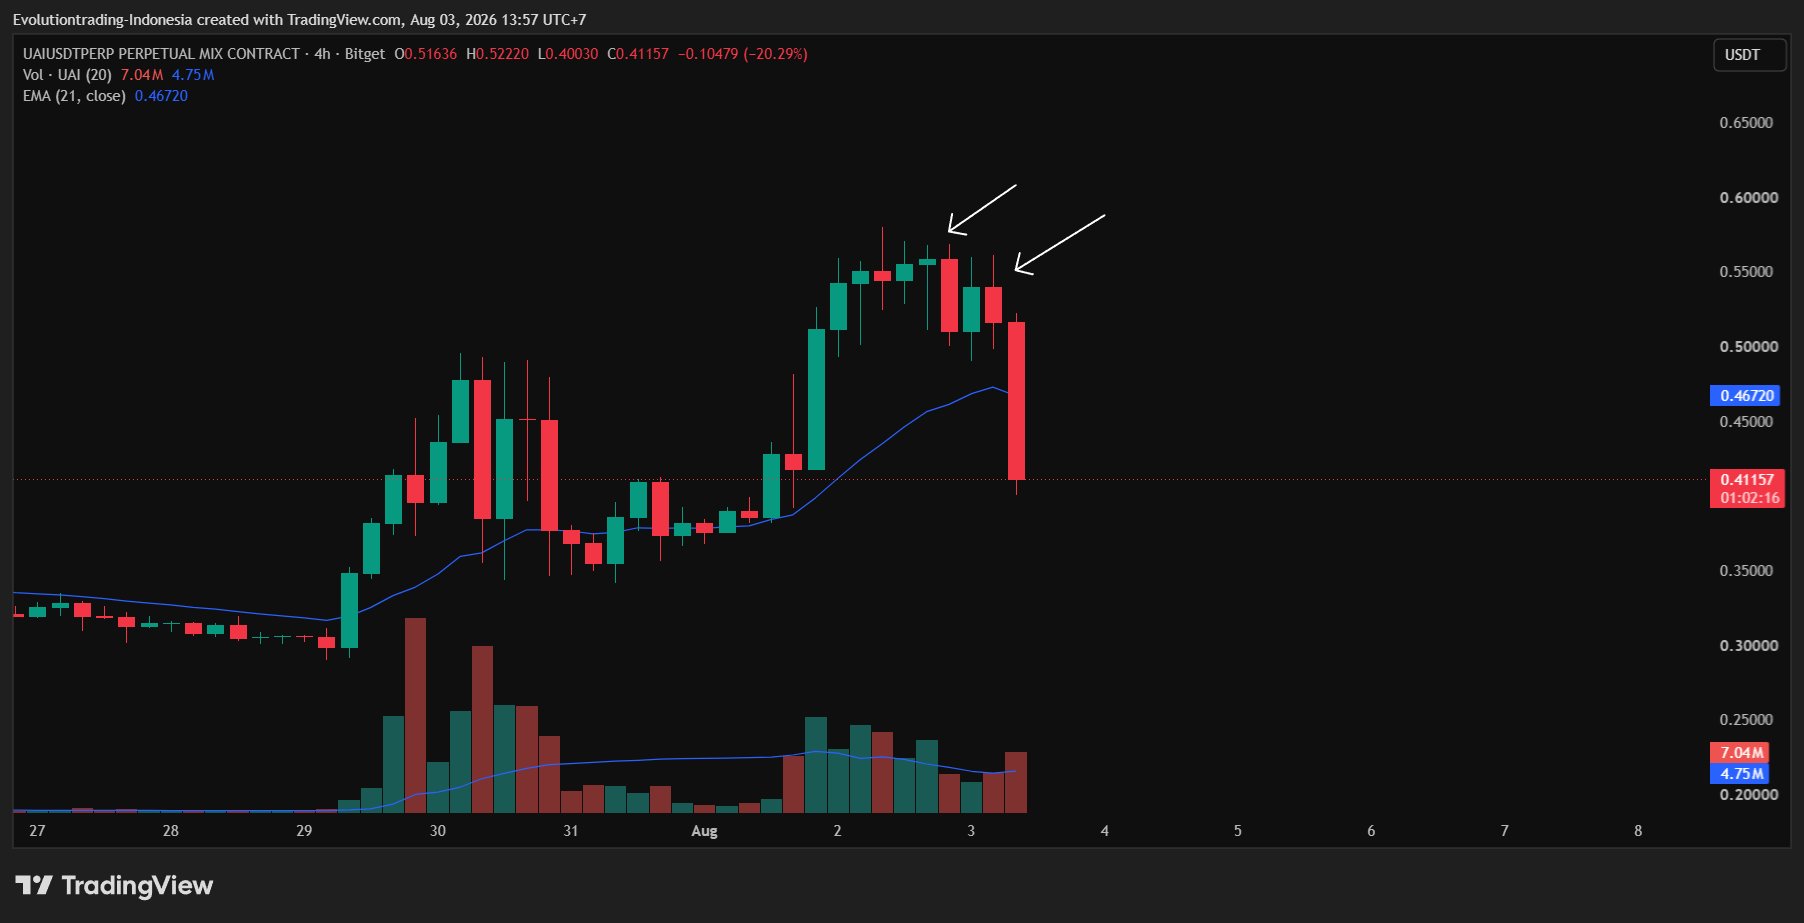
- Breakdown from key levels and/or 21 EMA. For the bearish version, big candles are still "okay" to trade. As long as you can handle the loss or patiently wait for a small pullback to find an optimal entry (see example in image 2, marked by arrows).

You can check several charts for this. Just mark the ones that meet the criteria, then move to step 3.

Step 3: Entry Trigger.
For now, we're specifically looking for short positions.
There are many ways, I'll cover them another time. But this time, let's use the 21 EMA on the 15‑minute or 1‑hour timeframe as resistance/support for entry.
We're looking for/waiting for a 15‑minute or 1‑hour candle to form a pattern with these conditions:
- Solid red body that's large with little or no lower wick, breaking through the 21 EMA on the 15‑minute timeframe
- Not a drop that's too big
- Even better if it previously broke out above the EMA, then failed by dropping to form a bearish candle.

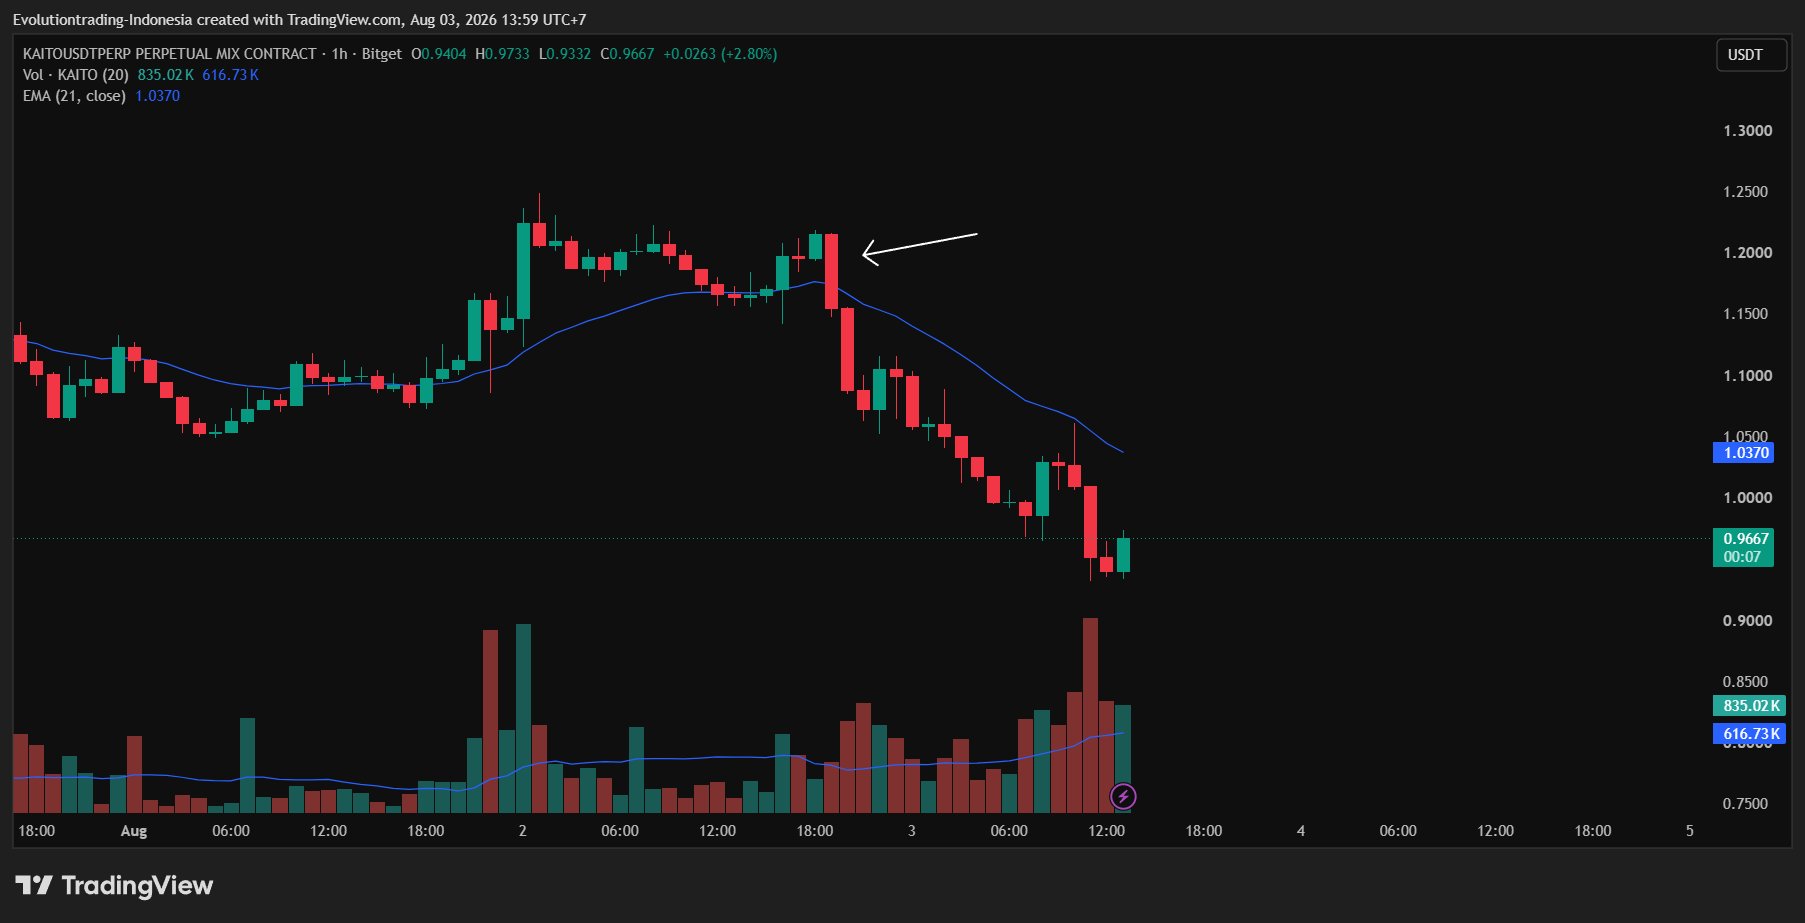
Check out arrows at image 3 and more example at image 4.

Step 4: Stop Loss, Take Profit, and Risk Management.
Place stop loss above the part of the candle that came out of the 21 EMA.
Take profit: Can aim for 2R first. But from my experience, crypto drops usually happen super fast. Can reach 4R or even 5R. But don't get greedy. 2R is enough in my opinion. The rest can be trailed.

Since this is day trading, and you can open many charts and enter several assets at once, just risk 0.5%‑1% per entry. And maximum total exposure to risk is 5%. Example: trade with 1% risk and hold 3 trade positions, then you're exposed to 3%.

Okay, go ahead and backtest it first. Or just front‑test it for a week.

Some limitations of this method:
- Sometimes we don't know if the crypto has truly crashed, or if it's just a correction. If it's just a correction on a larger timeframe, it could rise again even faster.
- Usually the current top losers have super volatile moves. Even 5x leverage can lead to liquidation. Make sure to calculate the risk properly.
view 4
view 1
view 1.4K
2026-08-03 14:12
Trend von AIO nach Veröffentlichung
Bullisch
Provides a detailed introduction to a day‑trading short‑term strategy that exploits a cryptocurrency's downtrend.
avatar
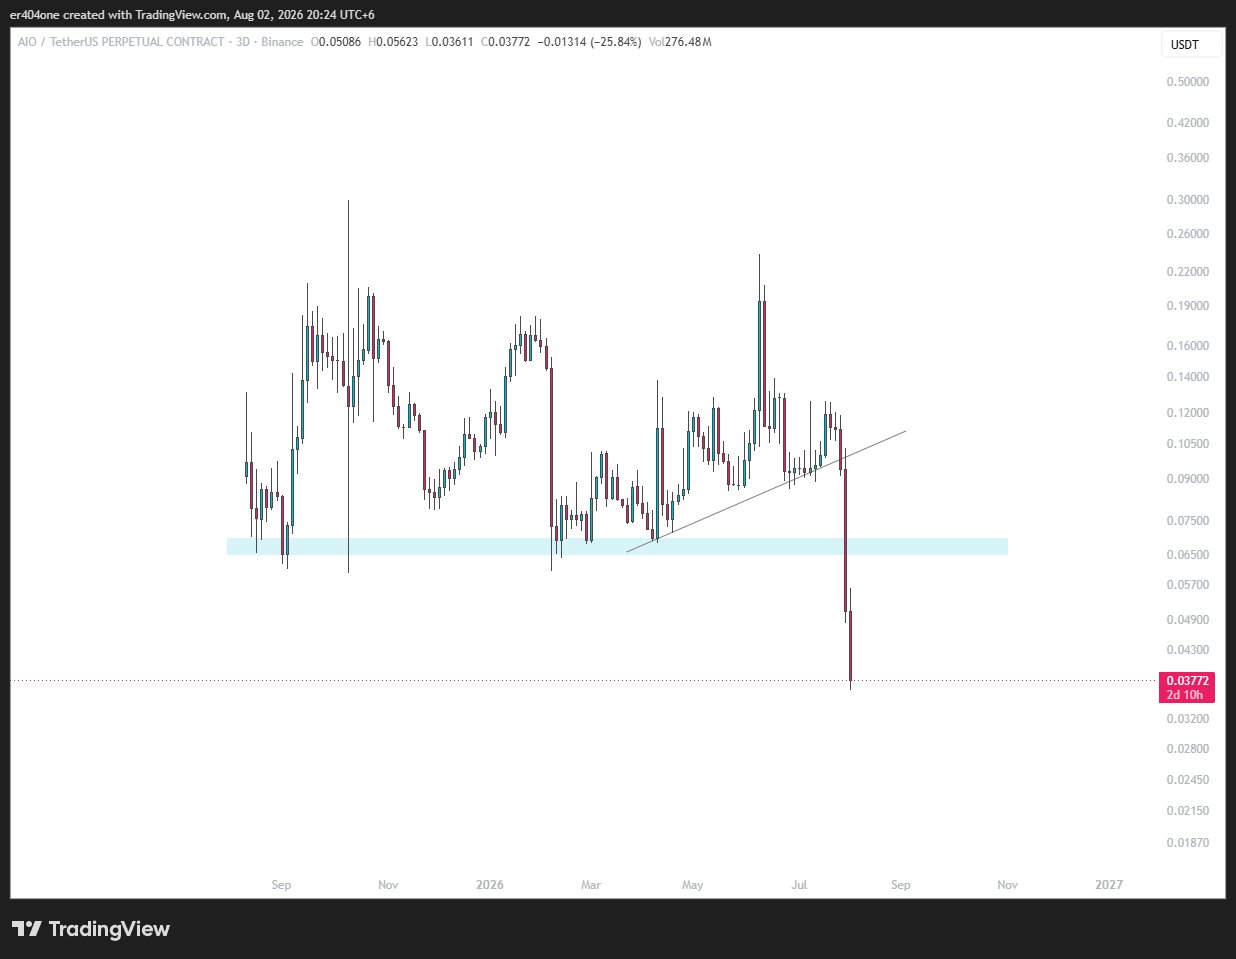
AIO is being called a scam, price plummets, breaking support.

Another scam dying so fast $AIO https://t.co/FZuvrw4Dpe

view 33
view 0
view 3.8K
2026-08-02 14:27
Trend von AIO nach Veröffentlichung
Extrem bärisch
AIO is being called a scam, price plummets, breaking support.
avatar
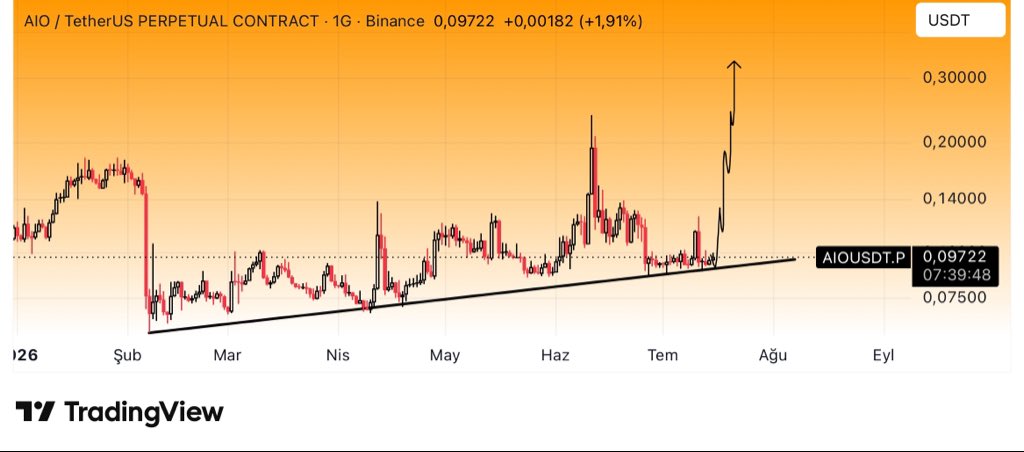
AIO has risen 20% along the expected path, and the chart shows a strong upward trend.

#AIOUSDT $AIO #Binance

So far, the chart has followed the projected path and delivered a 20% gain.

I’m continuing to monitor it closely.

avatar

#AIOUSDT $AIO #Bitcoin

#VELVET = #AIO

$AIO = 5/10 x ⏳⏳⏳⏳ https://t.co/Yil19Q2MEE

view 59
view 6
view 8.1K
2026-07-20 13:17
Trend von AIO nach Veröffentlichung
Bullisch
AIO has risen 20% along the expected path, and the chart shows a strong upward trend.
Einzelheiten

Preisprognose

Wann ist ein guter Zeitpunkt, um AIO zu kaufen? Soll ich AIO jetzt kaufen oder verkaufen?

Bei der Entscheidung, ob es ein guter Zeitpunkt ist, OLAXBT (AIO) zu kaufen oder zu verkaufen, ist es wichtig, sich zunächst an der eigenen Handelsstrategie und Ihrem Risikoprofil zu orientieren. Langfristig orientierte Anleger und kurzfristig orientierte Trader interpretieren Marktbedingungen oft unterschiedlich, daher sollte Ihre Entscheidung Ihre persönliche Herangehensweise widerspiegeln. Laut der neuesten vierstündigen technischen Analyse von AIO lautet das aktuelle Handelssignal Verkaufen. Laut der neuesten eintägigen technischen Analyse von AIO lautet das aktuelle Signal Halten.
23
Verkaufen
4-stündige technische Analyse von AIO
Letzte Aktualisierung 2026-08-15 19:59:59
50
Halten
Eintägige technische Analyse von AIO
Letzte Aktualisierung 2026-08-14 23:59:59
beacon

Beacon Vorhersage

Probabilistische Preisprognose (nächste 24 Stunden)
i
Haftungsausschluss für Beacon-Vorhersagen
Die auf dieser Seite angezeigten Datenergebnisse werden basierend auf tatsächlichen Handelsdaten (OHLCV) des ausgewählten Handelspaares und den entsprechenden technischen Indikatoren analysiert.
Diese Prognose ist ein experimentelles technisches Produkt und wird lediglich zu Informationszwecken angegeben. Dies stellt keine Anlageberatung dar. Unerwartete Ereignisse in der realen Welt können erhebliche Auswirkungen auf das Marktverhalten haben. Händler sollten Entscheidungen mit Vorsicht treffen.
Über OLAXBT
OLAXBT (AIO) is a cryptocurrency launched in 2025and operates on the BNB Smart Chain (BEP20) platform. OLAXBT has a current supply of 1,000,000,000 with 230,250,000 in circulation. The last known price of OLAXBT is 0.04384222 USD and is up 2.13 over the last 24 hours. It is currently trading on 113 active market(s) with $2,714,306.32 traded over the last 24 hours. More information can be found at https://olaxbt.xyz.
Mehr lesen