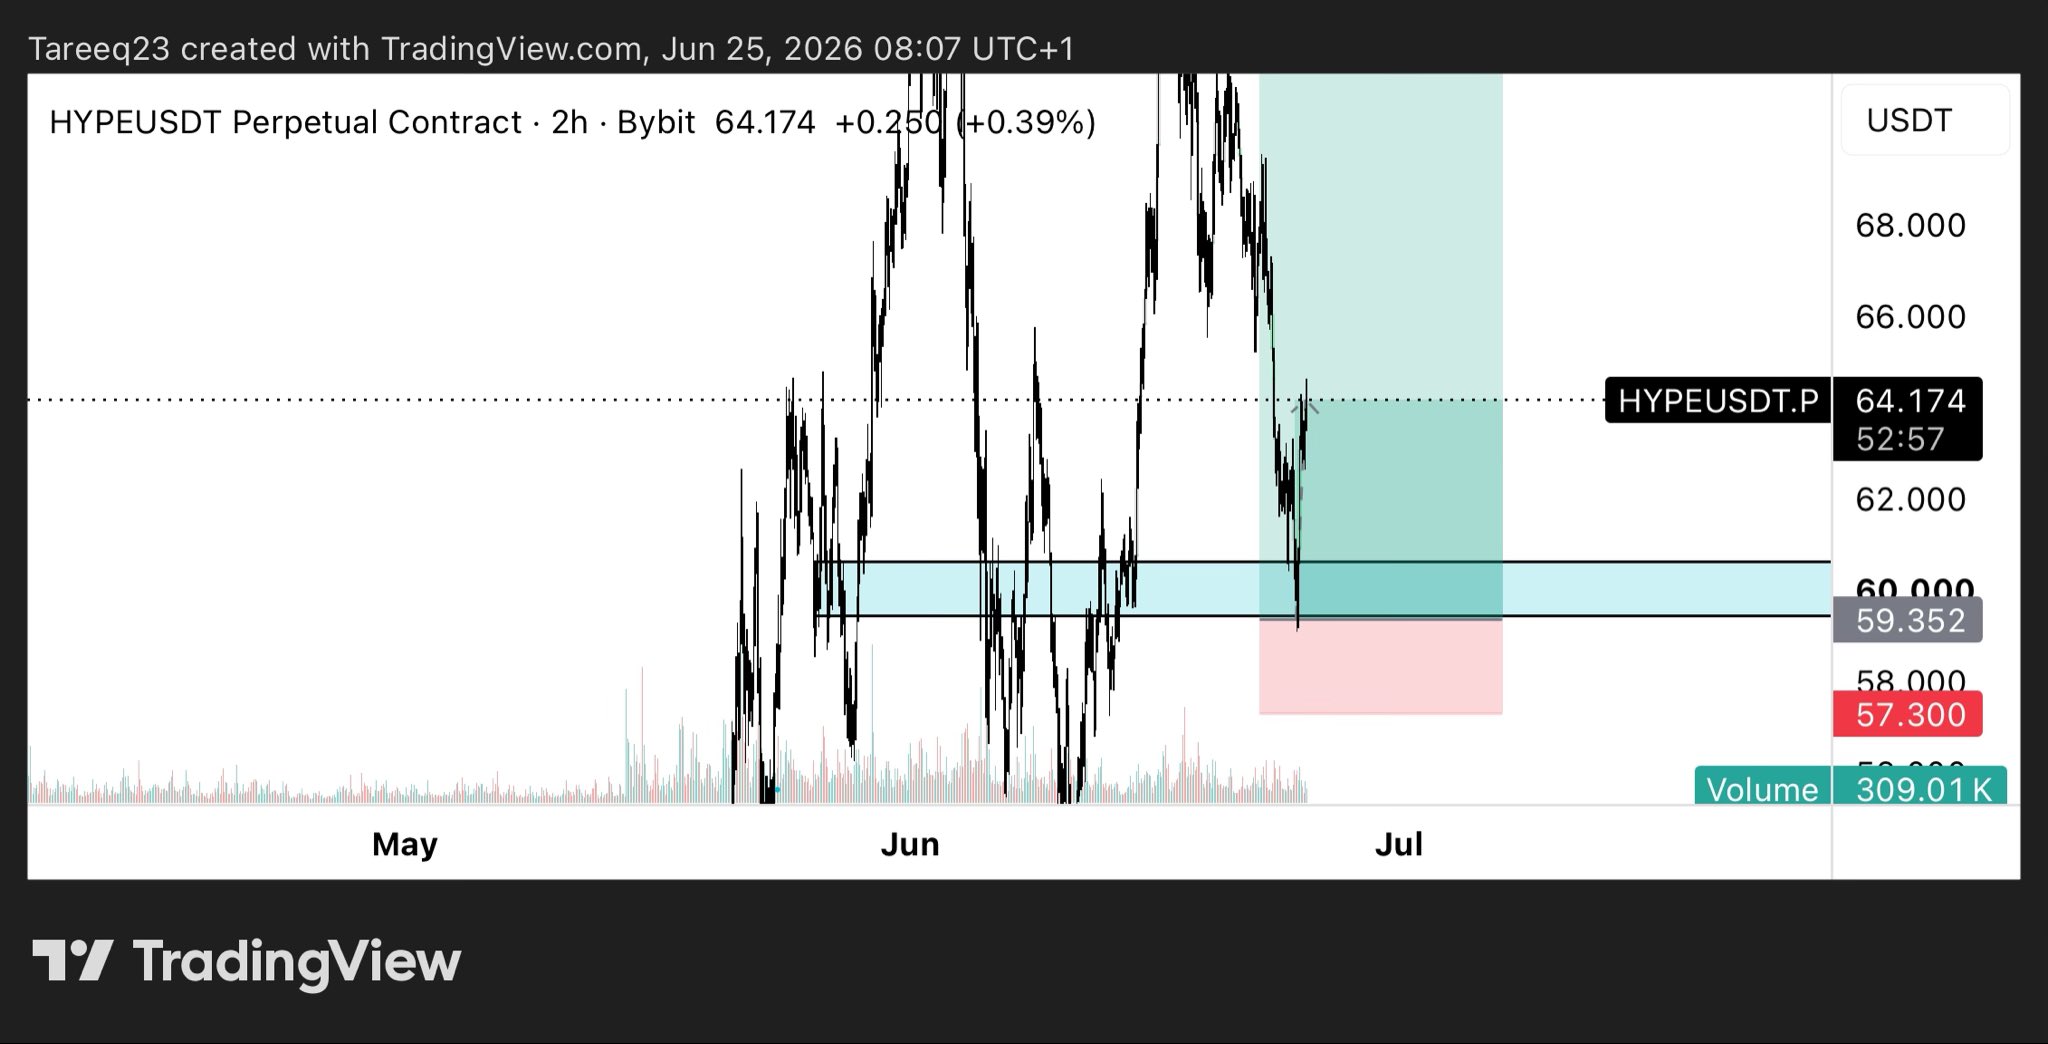
Fully closing $HYPE spot here. Nice lil 2.6r gain 🤝 https://t.co/iKksWRnI0E


 40.8K @Tareeq_23
 Fully closing $HYPE spot here. Nice lil 2.6r gain 🤝 https://t.co/iKksWRnI0E
40.8K @Tareeq_23 fully filled on $HYPE, EP is 59.35
 23
23
 9
9
 3.5K
3.5K
 2.3K @Shinobeme
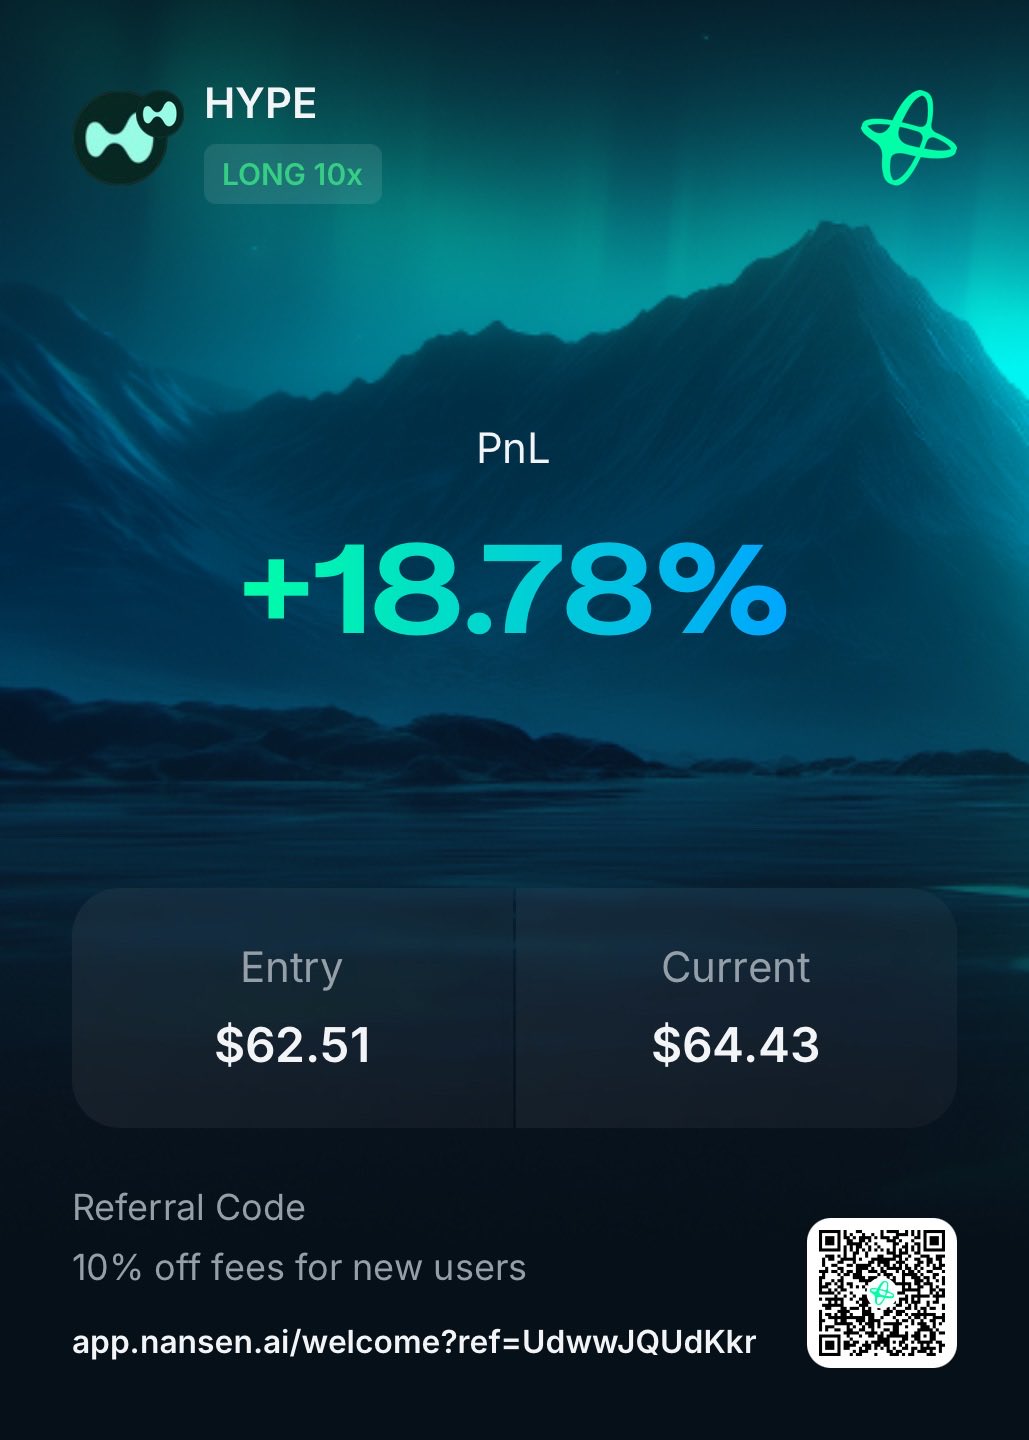
 HYPE +18.77% with @nansen_ai.
What's your latest trade? https://t.co/bfeWkGwAzG
 7
2
315
7
2
315
 3.4K @Vibeofweb3
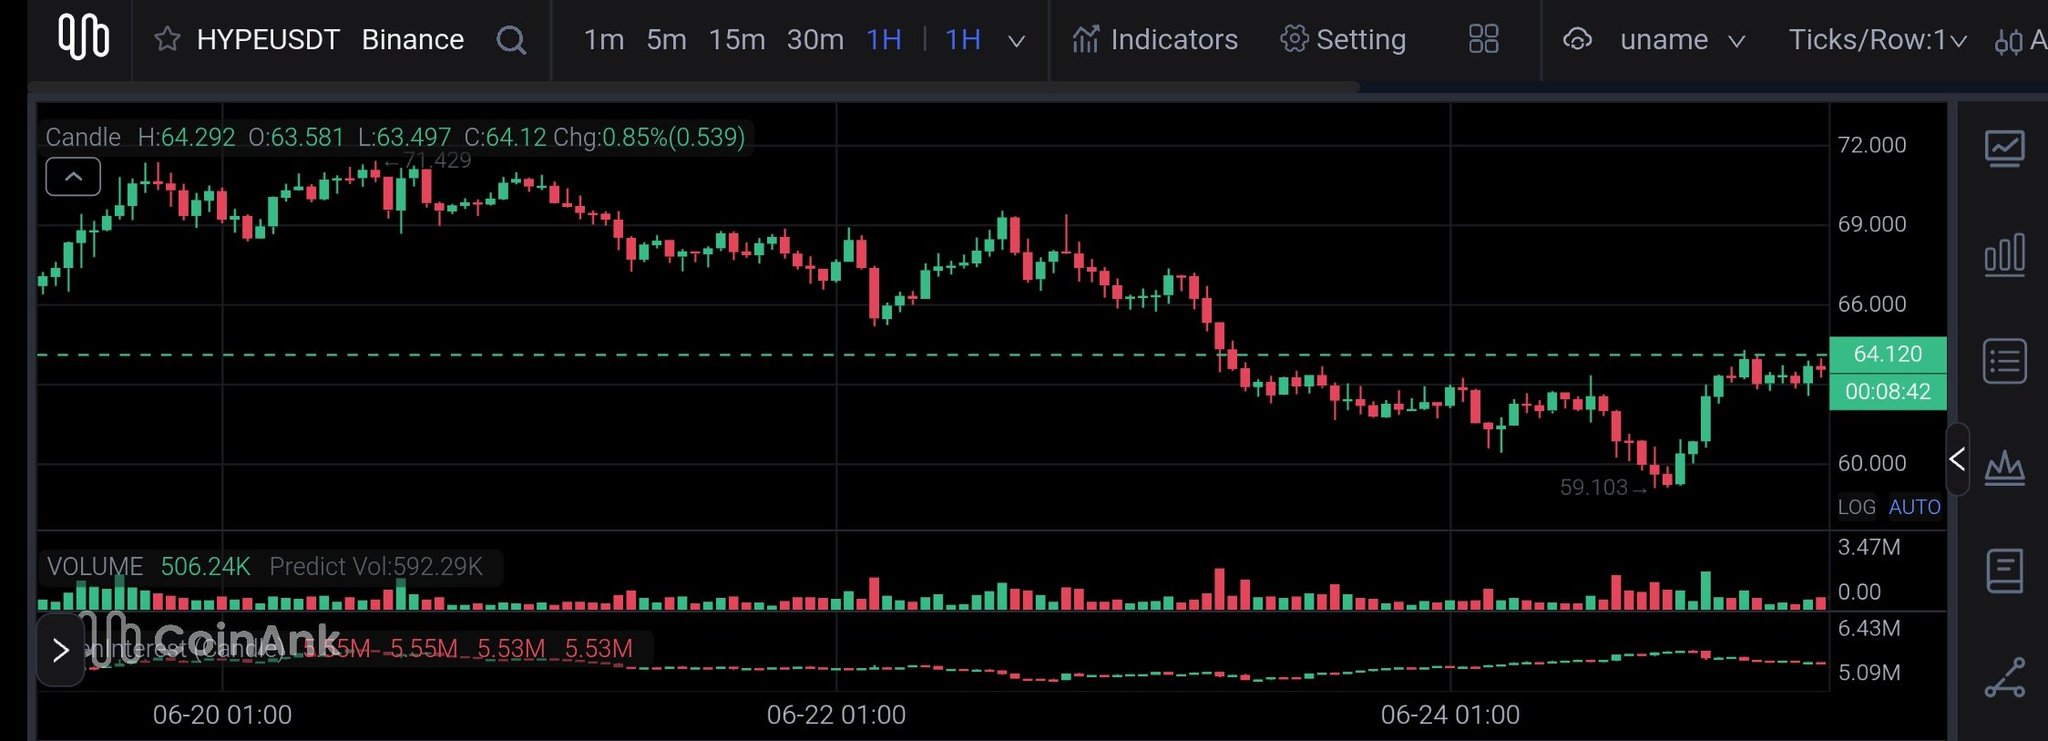
 HYPE/USDT Reading the Structure, Not the Noise
Current price: $64.12 | 1H OrderFlow FootPrint | Binance
The chart tells a clear story. $HYPE printed a local top near $71.40 before a measured distribution phase brought price down to a swing low at $59.10 a clean 17% move that most traders missed or misread.
What the FootPrint reveals that a standard candlestick chart won't:
Volume context at each candle is visible in real time.
The 506.24K volume on the current candle against a predicted 592.29K tells you participation is building not fading. Open interest sitting at -5.53M signals that short positioning has been accumulating through this decline. That's not bearish confirmation. That's a setup worth watching.
Price is now attempting a reclaim of the $64 level, which previously acted as equilibrium before the breakdown. The question isn't whether HYPE bounces it's whether the bid absorption at $59 was real or a liquidity grab.
@CoinAnk's OrderFlow FootPrint gives you the tools to answer that question with data, not guesswork. Predicted volume, open interest flow, and live footprint structure in one view across any timeframe, any pair.
This is what informed position management looks like.
📊 https://t.co/hvWSKyNE1t
#HYPE #HYPEUSDT #CoinAnk
 1
0
34
1
0
34