Rewards
Futures Daily Draw
100% Chance To Win With Daily Trades
Spot Daily Draw
Win 8,888 USDT In Grand Prizes
Mobile Top-Up
Top up mobiles easily, online, secure
Send
Send money globally, fast and secure
BitMart Mall
Live on crypto

Arkham Live Price data
Today's price of Arkham Is $ 0.11 (ARKM/USD). With A Market Cap Of $ 26.95M USD. 24-Hour Trading Volume Of $ 329.47K USD, A 24-Hour Price Change Of +2.77%, And A Circulating Supply Of 225.10M ARKM.
Arkham ARKM Price History USD
Track the price of Arkham for today, 7 days, 30 days and 90 days
Period
Change
Change (%)
Today
$ 0.0032
2.83%
7days
$ 0.011
-8.68%
30days
$ 0.041
-25.93%
90days
$ 0.018
18.78%
Own ARKM Now
Buy and sell ARKM easily and securely on BitMart.
Arkham Market Information
$ 0.11 24h Range $ 0.12
All time high
$ 3.99
All time low
$ 0.049
24h Change
2.77%
24h Vol
$ 329,465.14
Circulating supply
225.10M
ARKM
Market cap
$ 26.95M
Max supply
1.00B
ARKM
Fully diluted market cap
$ 119.74M
Trade ARKM

Arkham X Insight

GorkemCrypto
TA_Analyst
FA_Analyst
C
 185.0K @GorkemCrypto
 Extremely Bullish
ARKM is expected to break the descending wedge, technical outlook bullish, target 1255% gain.
GorkemCrypto
TA_Analyst
FA_Analyst
C
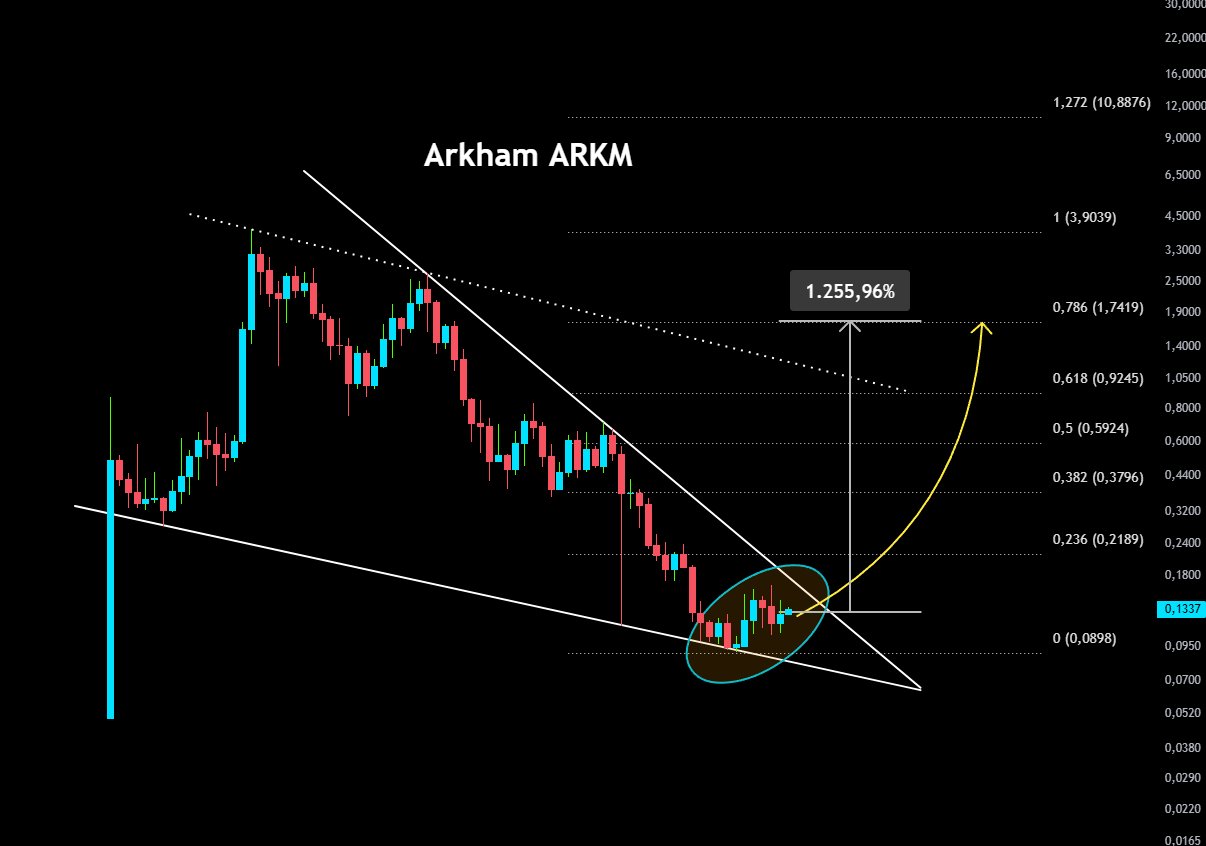
185.0K @GorkemCrypto In the Arkham chart, it can be seen that the price is in the upward breakout stage of the descending wedge it has been moving within for a long time.
The area marked with a turquoise ring represents a critical reversal zone where the descending trend resistance is being challenged and the price is trying to hold at the 0.1337 level with buying pressure from dip levels.
If this breakout is confirmed with volume at the current 0.1337 level, it could completely end the downtrend in the pair and turn the technical outlook positive.
If the formation completes upward, the upper resistance levels in the direction of the yellow arrow, with a projected 1,255.96% rise potential, can be followed as a medium‑long‑term target according to the chart projection.
Do you think Arkham, with its strong positioning among AI and data analytics focused projects, could turn this critical wedge breakout into a major rally?
Meet in the comments.
#ARKM #Arkham #Crypto $ARKM
 284
284
 13
13
 13.3K
13.3K
2026-06-26 10:38
Trend of ARKM after release
Extremely Bullish
ARKM is expected to break the descending wedge, technical outlook bullish, target 1255% gain.
GorkemCrypto
TA_Analyst
FA_Analyst
C
185.0K @GorkemCrypto Extremely Bullish
ARKM is on the edge of a descending wedge breakout, and if successful could have over 1200% upside potential.
GorkemCrypto
TA_Analyst
FA_Analyst
C
185.0K @GorkemCrypto In the Arkham chart, it can be seen that the price is in the upward breakout stage of the descending wedge it has been moving within for a long time.
The area marked with a turquoise ring represents a critical reversal zone where the descending trend resistance is being challenged and the price is trying to hold at the 0.1337 level with buying pressure from dip levels.
If this breakout is confirmed with volume at the current 0.1337 level, it could completely end the downtrend in the pair and turn the technical outlook positive.
If the formation completes upward, the upper resistance levels in the direction of the yellow arrow, with a projected 1,255.96% rise potential, can be followed as a medium‑long‑term target according to the chart projection.
Do you think Arkham, with its strong positioning among AI and data analytics focused projects, could turn this critical wedge breakout into a major rally?
Meet in the comments.
#ARKM #Arkham #Crypto $ARKM
284
13
13.3K
2026-06-24 10:38
Trend of ARKM after release
Extremely Bullish
ARKM is on the edge of a descending wedge breakout, and if successful could have over 1200% upside potential.
GorkemCrypto
TA_Analyst
FA_Analyst
C
185.0K @GorkemCrypto Extremely Bullish
ARKM is expected to break the descending wedge, technical outlook bullish, target 1255% gain.
In the Arkham chart, it can be seen that the price is in the upward breakout stage of the descending wedge it has been moving within for a long time.
The area marked with a turquoise ring represents a critical reversal zone where the descending trend resistance is being challenged and the price is trying to hold at the 0.1337 level with buying pressure from dip levels.
If this breakout is confirmed with volume at the current 0.1337 level, it could completely end the downtrend in the pair and turn the technical outlook positive.
If the formation completes upward, the upper resistance levels in the direction of the yellow arrow, with a projected 1,255.96% rise potential, can be followed as a medium‑long‑term target according to the chart projection.
Do you think Arkham, with its strong positioning among AI and data analytics focused projects, could turn this critical wedge breakout into a major rally?
Meet in the comments.
#ARKM #Arkham #Crypto $ARKM
284
13
13.3K
2026-06-23 09:38
Trend of ARKM after release
Extremely Bullish
ARKM is expected to break the descending wedge, technical outlook bullish, target 1255% gain.
Price Prediction
When is a good time to buy ARKM? Should I buy or sell ARKM now?
When deciding whether it’s a good time to buy or sell Arkham (ARKM), it’s important to first align with your own trading strategy and risk profile.Long-term investors and short-term traders often interpret market conditions differently, so your decision should reflect your personal approach. According to the latest ARKM 4-hour technical analysis, the current trading signal is Hold. According to the latest ARKM 1-day technical analysis, the current signal is Hold.

Beacon Prediction
Probabilistic Price Forecast (Next 24 Hours)Beacon Prediction Disclaimer
The data results displayed on this page are analyzed based on actual trading data (OHLCV) of the selected trading pair along with corresponding technical indicators.
This prediction is an experimental technical product and is provided for reference purposes only. It does not constitute investment advice. Unexpected real-world events may significantly impact market behavior. Traders should make decisions with caution.
This prediction is an experimental technical product and is provided for reference purposes only. It does not constitute investment advice. Unexpected real-world events may significantly impact market behavior. Traders should make decisions with caution.
About Arkham
Arkham (ARKM) is a cryptocurrency and operates on the Ethereum platform. Arkham has a current supply of 1,000,000,000 with 225,100,000 in circulation. The last known price of Arkham is 0.13303487 USD and is down -0.37 over the last 24 hours. It is currently trading on 265 active market(s) with $22,341,033.98 traded over the last 24 hours. More information can be found at https://arkm.com/.
Read More
Explore More
BM Discovery


New Listing

SOXLON Direxion Daily Semi Bull 3X ETF
-- 0.00%

NIOON NIO
-- 0.00%

HYGON iBoxx $ High Yield Corporate Bond ETF
-- 0.00%

AURON Aurora Innovation
-- 0.00%

IGVON iShares Expanded Tech-Software ETF
-- 0.00%

SQQQON ProShares UltraPro Short QQQ
-- 0.00%

IBITON iShares Bitcoin Trust ETF
-- 0.00%

AMCON AMC Entertainment Holdings
-- 0.00%

GRABON Grab Holdings
-- 0.00%

SNAPON Snap(Ondo)
-- 0.00%
Buy ARKM
Trade ARKM