Rewards
Futures Daily Draw
100% Chance To Win With Daily Trades
Spot Daily Draw
Win 8,888 USDT In Grand Prizes
Mobile Top-Up
Top up mobiles easily, online, secure
Send
Send money globally, fast and secure
BitMart Mall
Live on crypto

LAB Live Price data
Today's price of LAB Is $ 17.04 (LAB/USD). With A Market Cap Of $ 5.32B USD. 24-Hour Trading Volume Of $ 974.33K USD, A 24-Hour Price Change Of +5.90%, And A Circulating Supply Of 312.10M LAB.
LAB LAB Price History USD
Track the price of LAB for today, 7 days, 30 days and 90 days
Period
Change
Change (%)
Today
$ 0.80
4.96%
7days
$ 1.99
13.17%
30days
$ 12.81
298.25%
90days
$ 16.89
7,897.24%
Own LAB Now
Buy and sell LAB easily and securely on BitMart.
LAB Market Information
$ 15.54 24h Range $ 21.18
All time high
$ 27.82
All time low
$ 0.062
24h Change
5.90%
24h Vol
$ 974,331.15
Circulating supply
230.40M
LAB
Market cap
$ 3.92B
Max supply
1.00B
LAB
Fully diluted market cap
$ 17.04B
Trade LAB

LAB X Insight

Evening Trader Group
OnChain_Analyst
Trader
B
 30.4K @Eveningtraders
 Extremely Bullish
LAB has doubled and its supply is controlled, the upward trend may not be over.
Evening Trader Group
OnChain_Analyst
Trader
B
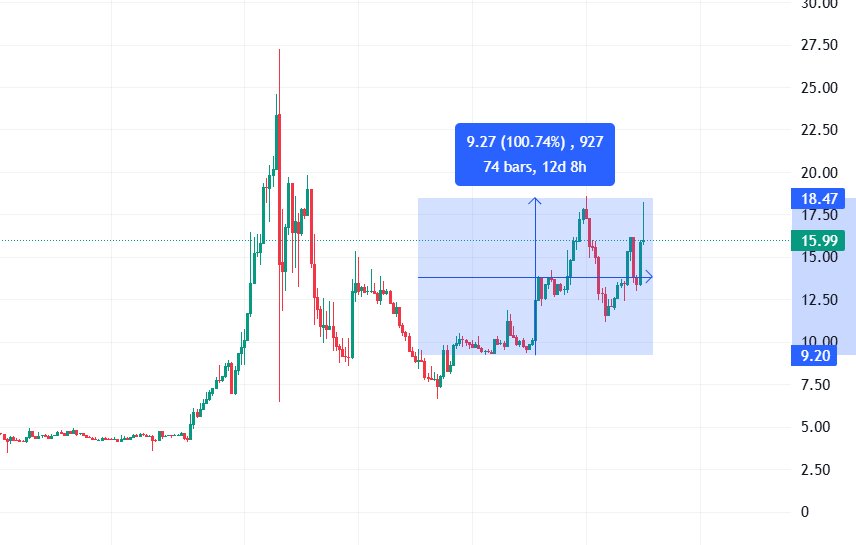
30.4K @Eveningtraders $LAB BOUNCED 2X SINCE THE LAST SNAPSHOT
$LAB is now up almost 2x from the last update.
Many traders love to chase shorts on these hype-token setups, thinking the move is already done.
We saw the same mindset on names like $SIREN, $VELVET, and $BEAT.
But these setups do not always end that easily.
$LAB still looks heavily controlled under Bitget MM flow, and with the recent token movements, it does not look like they are ready to let the chart die immediately.
On-chain snapshot remains important:
11 fresh wallets from Bitget still hold 100.34M $LAB.
Another project/team wallet received 133.00M $LAB from Bitget Cold Wallet.
Supply is still tightly controlled.
The $LAB story may not be over yet.

 20
20
 1
1
 6.8K
6.8K
2026-06-25 05:27
Trend of LAB after release
Extremely Bullish
LAB has doubled and its supply is controlled, the upward trend may not be over.

The Boss 🦅
TA_Analyst
Influencer
B
88.5K @CryptoTheBossX Extremely Bullish
LAB maintains a bullish structure, demand is strong, it is challenging a key resistance level, and breakout should be watched.
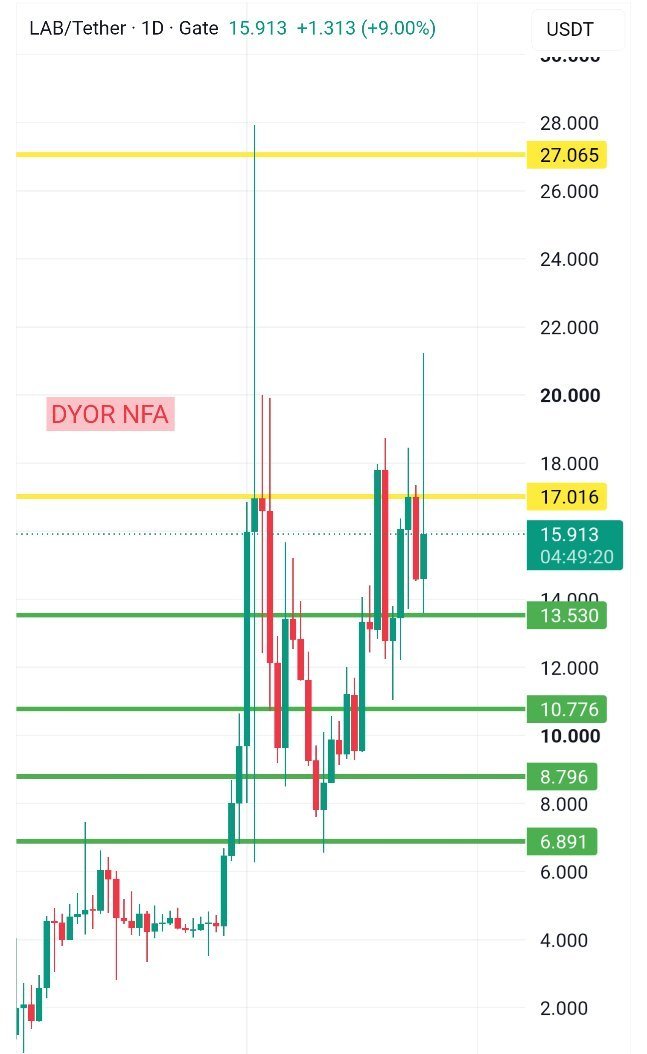
🔷️ $LAB continues to respect the structure that was highlighted days ago. Three days ago, price was trading near the lower green support zone, and since then buyers have successfully defended every major pullback while pushing the market back toward the upper yellow resistance area. 📈
The recent recovery from the green zones confirms that demand remains active, and the current move is once again testing the key yellow resistance level. This area has repeatedly acted as a decision point, making the reaction here especially important for the next trend direction. 👀
From a technical perspective, the chart still shows a series of higher lows despite the volatility. As long as price remains above the green support cluster, the bullish structure remains intact. A decisive move above the current yellow resistance would strengthen momentum and open the door for a challenge of the next major yellow zone. 🎯
The fact that price recovered strongly after the previous rejection and returned to resistance within a few sessions is a sign of underlying strength. For now, the battle between buyers and sellers is taking place at a critical level, making this one of the charts worth watching closely in the coming days. 🔥
⚠️ Not financial advice.
#LAB #Bitcoin #Ethereum #Crypto #Altcoins
The Boss 🦅
TA_Analyst
Influencer
B
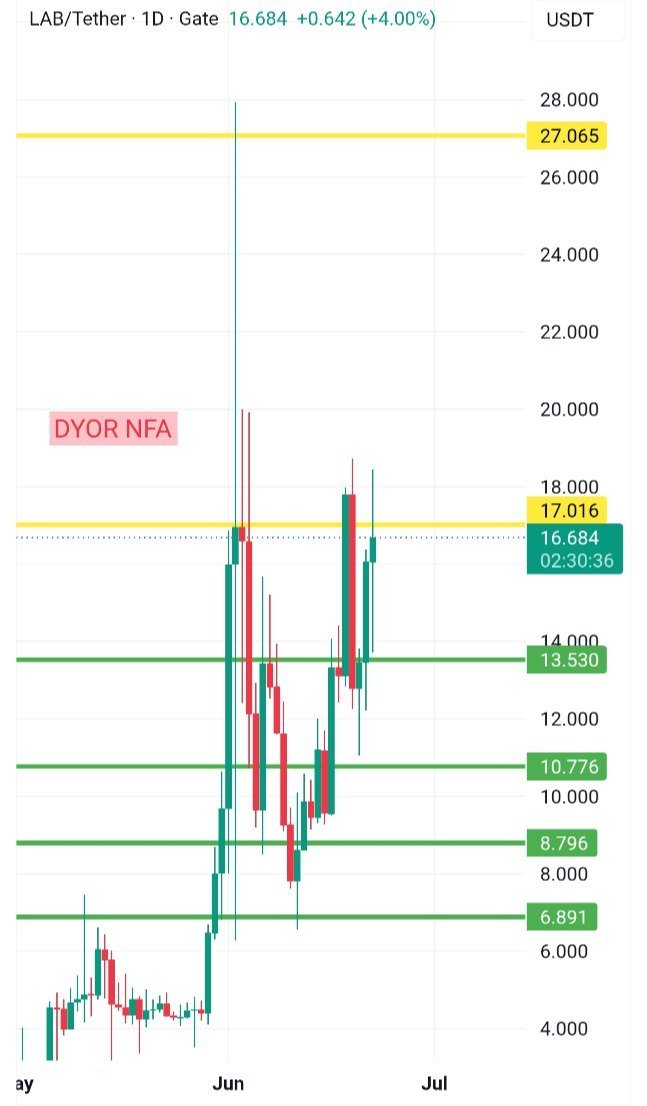
88.5K @CryptoTheBossX 🔷️ $LAB is one of the strongest momentum charts I've been tracking recently. Looking back at the chart I shared yesterday, price was sitting around the first yellow resistance zone and trying to establish support above the green levels. Today, buyers followed through and pushed the market directly into the next major yellow resistance area. 📈
What's interesting here is that yesterday's resistance has effectively turned into a support zone, showing that demand remains aggressive. The green support levels continue to hold, while the upper yellow region is now acting as the main battlefield between buyers and sellers. A successful reclaim of this area could significantly strengthen the current bullish structure. ⚡️
Personally, I like the way #LAB has been absorbing volatility and consistently printing higher lows after each pullback. The fact that the market managed to recover so quickly from recent sell pressure suggests that participants are still willing to buy dips rather than chase exits. For now, I'm wat
 167
27
19.0K
167
27
19.0K
2026-06-24 19:27
Trend of LAB after release
Extremely Bullish
LAB maintains a bullish structure, demand is strong, it is challenging a key resistance level, and breakout should be watched.
The Boss 🦅
TA_Analyst
Influencer
B
88.5K @CryptoTheBossX Extremely Bullish
LAB maintains a bullish structure, demand is strong, it is challenging a key resistance level, and breakout should be watched.
🔷️ $LAB is one of the strongest momentum charts I've been tracking recently. Looking back at the chart I shared yesterday, price was sitting around the first yellow resistance zone and trying to establish support above the green levels. Today, buyers followed through and pushed the market directly into the next major yellow resistance area. 📈
What's interesting here is that yesterday's resistance has effectively turned into a support zone, showing that demand remains aggressive. The green support levels continue to hold, while the upper yellow region is now acting as the main battlefield between buyers and sellers. A successful reclaim of this area could significantly strengthen the current bullish structure. ⚡️
Personally, I like the way #LAB has been absorbing volatility and consistently printing higher lows after each pullback. The fact that the market managed to recover so quickly from recent sell pressure suggests that participants are still willing to buy dips rather than chase exits. For now, I'm wat
145
23
13.1K
2026-06-22 21:57
Trend of LAB after release
Extremely Bullish
LAB maintains a bullish structure, demand is strong, it is challenging a key resistance level, and breakout should be watched.
Price Prediction
When is a good time to buy LAB? Should I buy or sell LAB now?
When deciding whether it’s a good time to buy or sell LAB (LAB), it’s important to first align with your own trading strategy and risk profile.Long-term investors and short-term traders often interpret market conditions differently, so your decision should reflect your personal approach. According to the latest LAB 4-hour technical analysis, the current trading signal is Hold. According to the latest LAB 1-day technical analysis, the current signal is Hold.

Beacon Prediction
Probabilistic Price Forecast (Next 24 Hours)Beacon Prediction Disclaimer
The data results displayed on this page are analyzed based on actual trading data (OHLCV) of the selected trading pair along with corresponding technical indicators.
This prediction is an experimental technical product and is provided for reference purposes only. It does not constitute investment advice. Unexpected real-world events may significantly impact market behavior. Traders should make decisions with caution.
This prediction is an experimental technical product and is provided for reference purposes only. It does not constitute investment advice. Unexpected real-world events may significantly impact market behavior. Traders should make decisions with caution.
About LAB
LAB (LAB) is a cryptocurrency launched in 2025and operates on the BNB Smart Chain (BEP20) platform. LAB has a current supply of 1,000,000,000 with 312,095,186 in circulation. The last known price of LAB is 14.77771641 USD and is up 19.12 over the last 24 hours. It is currently trading on 212 active market(s) with $79,962,922.09 traded over the last 24 hours. More information can be found at https://lab.pro/.
Read More
Explore More
BM Discovery


New Listing

SQQQON ProShares UltraPro Short QQQ
-- 0.00%

IBITON iShares Bitcoin Trust ETF
-- 0.00%

AMCON AMC Entertainment Holdings
-- 0.00%

GRABON Grab Holdings
-- 0.00%

SNAPON Snap(Ondo)
-- 0.00%

NES Nesa
-- 0.00%

HIVEON HIVE Digital Technologies
-- 0.00%

SOXSON Direxion Daily Semi Bear 3X ETF
-- 0.00%

TON AT&T Tokenized Stock (Ondo)
-- 0.00%

KEELON Keel Infrastructure
-- 0.00%
Buy LAB
Trade LAB