Comprar cripto
tarjeta
Comercio P2P
Compra USDT en un marketplace
Tarjeta de crédito/débito
Compre criptomonedas con Visa o MasterCard
Pago vía prestadores
Compre criptomonedas a través de MoonPay, Simplex y más
Tarjeta BitMart
Impulsando su experiencia con las criptomonedas
Tarjeta prepago de criptomonedas
Obtenga una Mastercard lista para usar al instante
Comerciar
USDⓈ-M
Utilizando USDⓈ como colateral
COIN-M
Utilizando la propia moneda como colateral
TradFi
Trading integral para metales, acciones y forex
Operativa de demostración
Aprenda a operar con riesgo cero
Resumen de futuros
Plataforma única para todo lo relacionado con futuros
Rey de Futuros
Pool de premios de 478 000 USDT
Crecer
Resumen de Earn
Activos inactivos, gane con facilidad
Ahorros
Gane intereses conservando su portafolio.
Staking
Staking sencillo, cuantiosas retribuciones.
Gestión de patrimonio
Aumente su riqueza con un equipo de activos top
RWA
Mantenga BMRUSD, disfrute del rendimiento
Exclusivo VIP
Gane de forma estable para usuarios VIP
Rewards
Centro de recompensas
Descubra recompensas exclusivas por valor de hasta 14 000 USDT
LaunchPrime
Una plataforma para lanzar tokens y NFT
Programa de afiliados
Únase para ganar cuantiosas comisiones
Powerdrop
¡La solución AirDrop de próxima generación ya está AQUÍ!
Centro de eventos
El centro unificado para todas las operaciones de trading
Sorteo diario de futuros
100 % de probabilidades de ganar con operaciones diarias
Sorteo diario de Spot
Gane 8888 USDT en grandes premios
Recarga móvil
Recargue móviles de forma fácil, online y segura
Send
Send money globally, fast and secure
BitMart Mall
Viva de las criptomonedas

Frax (prev. FXS) (FRAX)
$ 0.23 (FRAX/USD)
0.00%
24H
Frax (prev. FXS) Datos de precios en tiempo real
El precio de hoy de Frax (prev. FXS) es de $ 0.23 (FRAX/USD). Con una capitalización de mercado de $ 22.43M USD. Volumen de trading en 24 horas de $ 405.03K USD, Un cambio de precio en 24 horas de +0.00%. Y un suministro circulante de 93.60M FRAX.
Frax (prev. FXS) FRAX Historial de precios USD
Siga el precio de Frax (prev. FXS) para hoy, 7 días, 30 días y 90 días
Periodo
Cambiar
Cambio (%)
Hoy
$ 0
0.00%
7días
$ 0.019
-7.69%
30días
$ 0.15
-40.00%
90días
$ 0.16
-41.46%
Sea propietario de FRAX ahora
Compra y vende FRAX fácil y seguro en BitMart.
Frax (prev. FXS) Información de mercado
$ 0.22 Autonomía de 24 horas $ 0.23
Máximo histórico
$ 1.47
El mínimo histórico
$ 0.22
Cambio en 24 h
0.00%
Volumen en 24 h
$ 405,031.09
Suministros en circulación
93.59M
FRAX
Market Cap
$ 22.43M
Suministro máximo
99.68M
FRAX
Capitalización de mercado totalmente diluida
$ 23.89M
Trade FRAX
Ganar
Pon a trabajar tus criptomonedas inactivas y obtén ingresos pasivos a través de ahorros, staking y más.
Frax (prev. FXS) X Insight

captnhayz ¤
DeFi_Expert
Community_Lead
B
 3.3K @captnhayz
 Neutral
FRAX is consolidating in the $0.22-$0.26 range, awaiting a breakout to determine the next direction.

Charmander D
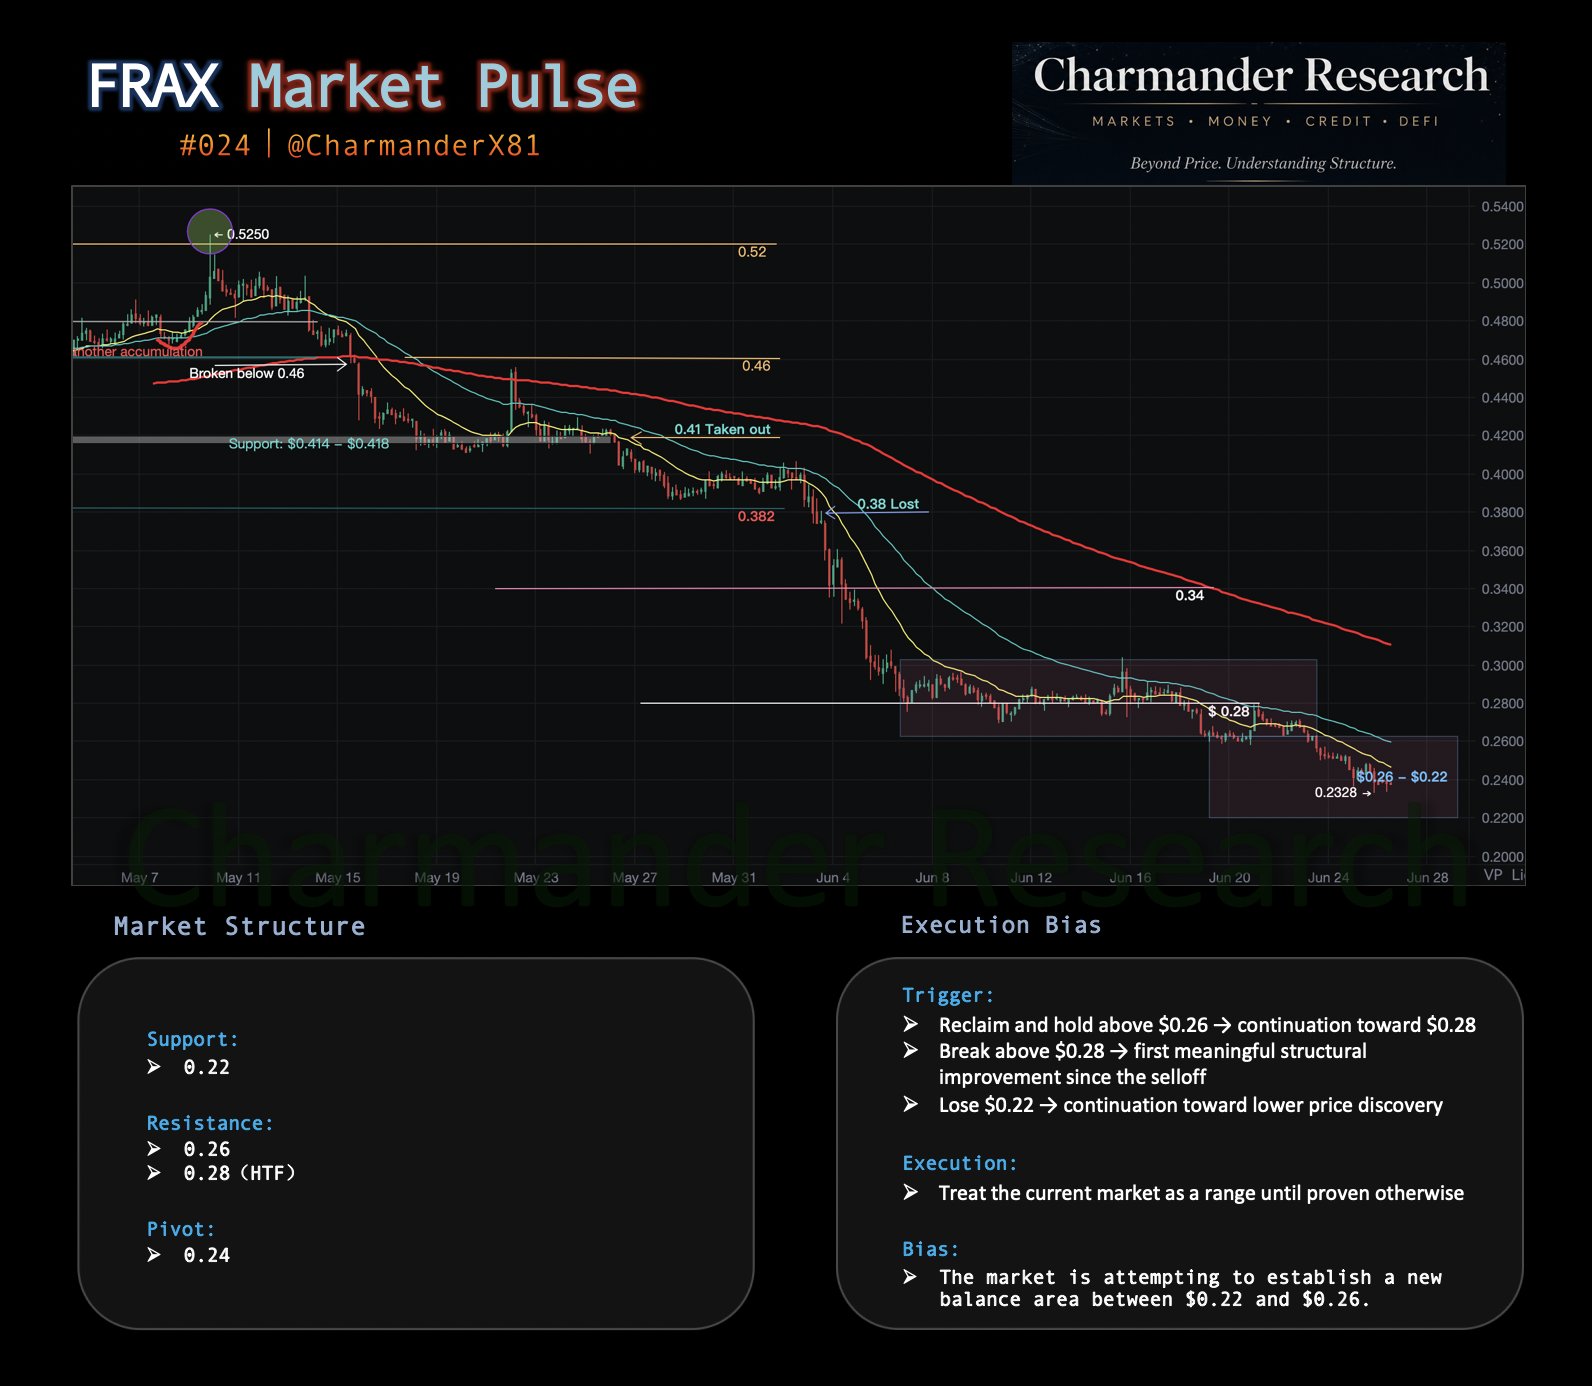
141 @CharmanderX81 [ $FRAX Market Pulse 🔥 #24 ]
🔔 Market
Over the past week, price has continued consolidating inside the $0.22–$0.26 trading range that we identified in the previous Market Pulse.
Rather than accelerating lower, the market is beginning to accept this new range as its short-term balance area.
After breaking below the previous $0.26–$0.30 box, price is no longer searching for the next support.
It is now searching for a new equilibrium.
So far, buyers have continued defending the lower portion of the range, while rallies remain capped below $0.26.
The market is building energy. The next directional move will likely come from a breakout of this balance area.
Current Structure
Support: $0.22
Resistance: $0.26 & $0.28 (HTF)
Pivot: $0.24
Trigger
• Reclaim and hold above $0.26 → continuation toward $0.28
• Break above $0.28 → first meaningful structural improvement since the selloff
• Lose $0.22 → continuation toward lower price discovery
Execution
• Treat the current market as a range until proven otherwise
 8
8
 0
0
 157
157
2026-06-26 06:27
Tendencia de FRAX tras el lanzamiento
Neutral
FRAX is consolidating in the $0.22-$0.26 range, awaiting a breakout to determine the next direction.
captnhayz ¤
DeFi_Expert
Community_Lead
B
3.3K @captnhayz Neutral
FRAX may launch a new product, but there is no clear signal in the short term

Sean Kelley D
3.4K @SeanKelleyX @0xNairolf imagine it being offered by @Frax 🔜
21
5
352
2026-06-24 15:27
Tendencia de FRAX tras el lanzamiento
Neutral
FRAX may launch a new product, but there is no clear signal in the short term
captnhayz ¤
DeFi_Expert
Community_Lead
B
3.3K @captnhayz Alcista
Frax is seen as a robust peg keeper, worth watching.

Alto D
35.3K @alto_money Frax: The Patrician Choice for Pegkeeping https://t.co/4E8urms5V2
20
0
3.0K
2026-06-24 12:57
Tendencia de FRAX tras el lanzamiento
Alcista
Frax is seen as a robust peg keeper, worth watching.
Predicción de precios
¿Cuándo es un buen momento para comprar FRAX? ¿Debería comprar o vender FRAX ahora?
Al decidir si es un buen momento para comprar o vender Frax (prev. FXS) (FRAX), es importante ajustarse primero a su propia estrategia de trading y perfil de riesgo. Los inversores a largo plazo y los traders a corto plazo suelen interpretar las condiciones del mercado de forma diferente, por lo que su decisión debe reflejar su enfoque personal. Según el último análisis técnico de 4 horas de FRAX, la señal de trading actual es Hold. Según el último análisis técnico de 1 día de FRAX, la señal actual es Hold.

Predicción de Beacon
Pronóstico probabilístico de precios (próximas 24 horas)Descargo de responsabilidad de la predicción de Beacon
Los resultados de los datos que se muestran en esta página se analizan en función de los datos de trading reales (OHLCV) del par de trading seleccionado junto con los indicadores técnicos correspondientes.
Esta predicción es un producto técnico experimental y se proporciona solo con fines de referencia. No constituye un consejo de inversión. Los acontecimientos inesperados del mundo real pueden influir significativamente en el comportamiento del mercado. Por tanto, los traders deben tomar decisiones con precaución.
Esta predicción es un producto técnico experimental y se proporciona solo con fines de referencia. No constituye un consejo de inversión. Los acontecimientos inesperados del mundo real pueden influir significativamente en el comportamiento del mercado. Por tanto, los traders deben tomar decisiones con precaución.
Sobre Frax (prev. FXS)
Frax (prev. FXS) (FRAX) is a cryptocurrency launched in 2020and operates on the Ethereum platform. Frax (prev. FXS) has a current supply of 99,681,495.59113361 with 93,597,685.70121376 in circulation. The last known price of Frax (prev. FXS) is 0.26855063 USD and is down -1.81 over the last 24 hours. It is currently trading on 338 active market(s) with $432,050.48 traded over the last 24 hours. More information can be found at https://frax.com.
Leer más
Enlaces oficiales
Explorador de blockchain
Explorar más
BM Discovery


Nuevo listado

SOXLON Direxion Daily Semi Bull 3X ETF
-- 0.00%

NIOON NIO
-- 0.00%

HYGON iBoxx $ High Yield Corporate Bond ETF
-- 0.00%

AURON Aurora Innovation
-- 0.00%

IGVON iShares Expanded Tech-Software ETF
-- 0.00%

SQQQON ProShares UltraPro Short QQQ
-- 0.00%

IBITON iShares Bitcoin Trust ETF
-- 0.00%

AMCON AMC Entertainment Holdings
-- 0.00%

GRABON Grab Holdings
-- 0.00%

SNAPON Snap(Ondo)
-- 0.00%