Comprar cripto
tarjeta
Comercio P2P
Compra USDT en un marketplace
Tarjeta de crédito/débito
Compre criptomonedas con Visa o MasterCard
Pago vía prestadores
Compre criptomonedas a través de MoonPay, Simplex y más
Tarjeta BitMart
Impulsando su experiencia con las criptomonedas
Tarjeta prepago de criptomonedas
Obtenga una Mastercard lista para usar al instante
Comerciar
USDⓈ-M
Utilizando USDⓈ como colateral
COIN-M
Utilizando la propia moneda como colateral
TradFi
Trading integral para metales, acciones y forex
Operativa de demostración
Aprenda a operar con riesgo cero
Resumen de futuros
Plataforma única para todo lo relacionado con futuros
Rey de Futuros
Pool de premios de 478 000 USDT
Crecer
Resumen de Earn
Activos inactivos, gane con facilidad
Ahorros
Gane intereses conservando su portafolio.
Staking
Staking sencillo, cuantiosas retribuciones.
Gestión de patrimonio
Aumente su riqueza con un equipo de activos top
RWA
Mantenga BMRUSD, disfrute del rendimiento
Exclusivo VIP
Gane de forma estable para usuarios VIP
Rewards
Centro de recompensas
Descubra recompensas exclusivas por valor de hasta 14 000 USDT
LaunchPrime
Una plataforma para lanzar tokens y NFT
Programa de afiliados
Únase para ganar cuantiosas comisiones
Powerdrop
¡La solución AirDrop de próxima generación ya está AQUÍ!
Centro de eventos
El centro unificado para todas las operaciones de trading
Sorteo diario de futuros
100 % de probabilidades de ganar con operaciones diarias
Sorteo diario de Spot
Gane 8888 USDT en grandes premios
Recarga móvil
Recargue móviles de forma fácil, online y segura
Send
Send money globally, fast and secure
BitMart Mall
Viva de las criptomonedas

Nebius Group NV (Derivatives) (NBIS)
$ 261.89 (NBIS/USD)
7.51%
24H
Nebius Group NV (Derivatives) NBIS Historial de precios USD
Siga el precio de Nebius Group NV (Derivatives) para hoy, 7 días, 30 días y 90 días
Periodo
Cambiar
Cambio (%)
Hoy
$ 18.29
7.51%
7días
$ 38.22
-13.40%
30días
$ 11.61
4.93%
90días
$ 11.61
4.93%
Sea propietario de NBIS ahora
Compra y vende NBIS fácil y seguro en BitMart.
Nebius Group NV (Derivatives) Información de mercado
$ 235.90 Autonomía de 24 horas $ 260.65
Máximo histórico
$ 297.52
El mínimo histórico
$ 201.05
Cambio en 24 h
7.51%
Volumen en 24 h
$ 0
Suministros en circulación
0.00
NBIS
Market Cap
$ 0
Suministro máximo
--
Capitalización de mercado totalmente diluida
$ 0
Trade NBIS
Ganar
Pon a trabajar tus criptomonedas inactivas y obtén ingresos pasivos a través de ahorros, staking y más.
Nebius Group NV (Derivatives) X Insight

Yimin X
Quant
FA_Analyst
B
 14.5K @yxinsights
 Alcista
NBIS is supported at $252.56, showing a short-term rebound trend.

Ace D
5.4K @acethebulllly $NBIS continues building a constructive intraday recovery as buyers absorb pullbacks and steadily reclaim higher prices while overhead liquidity limits immediate upside beneath the 5.56K ask wall at $260.01. Price trades at $252.56 as bid support continues absorbing sell pressure, and holding above the larger liquidity clusters keeps short-term momentum favoring buyers while a break through overhead supply opens the path for further expansion.
Resistance:
• $257.99 — 3.68K ask
• $260.01 — 5.56K ask
• $262.01 — 3.12K ask
Support:
• $252.56 — 15.91K bid
• $246.99 — 6.32K bid
• $243.01 — 4.65K bid
 7
7
 17
17
 1.0K
1.0K
2026-06-29 16:37
Tendencia de NBIS tras el lanzamiento
Alcista
NBIS is supported at $252.56, showing a short-term rebound trend.

chad.
TA_Analyst
Trader
B
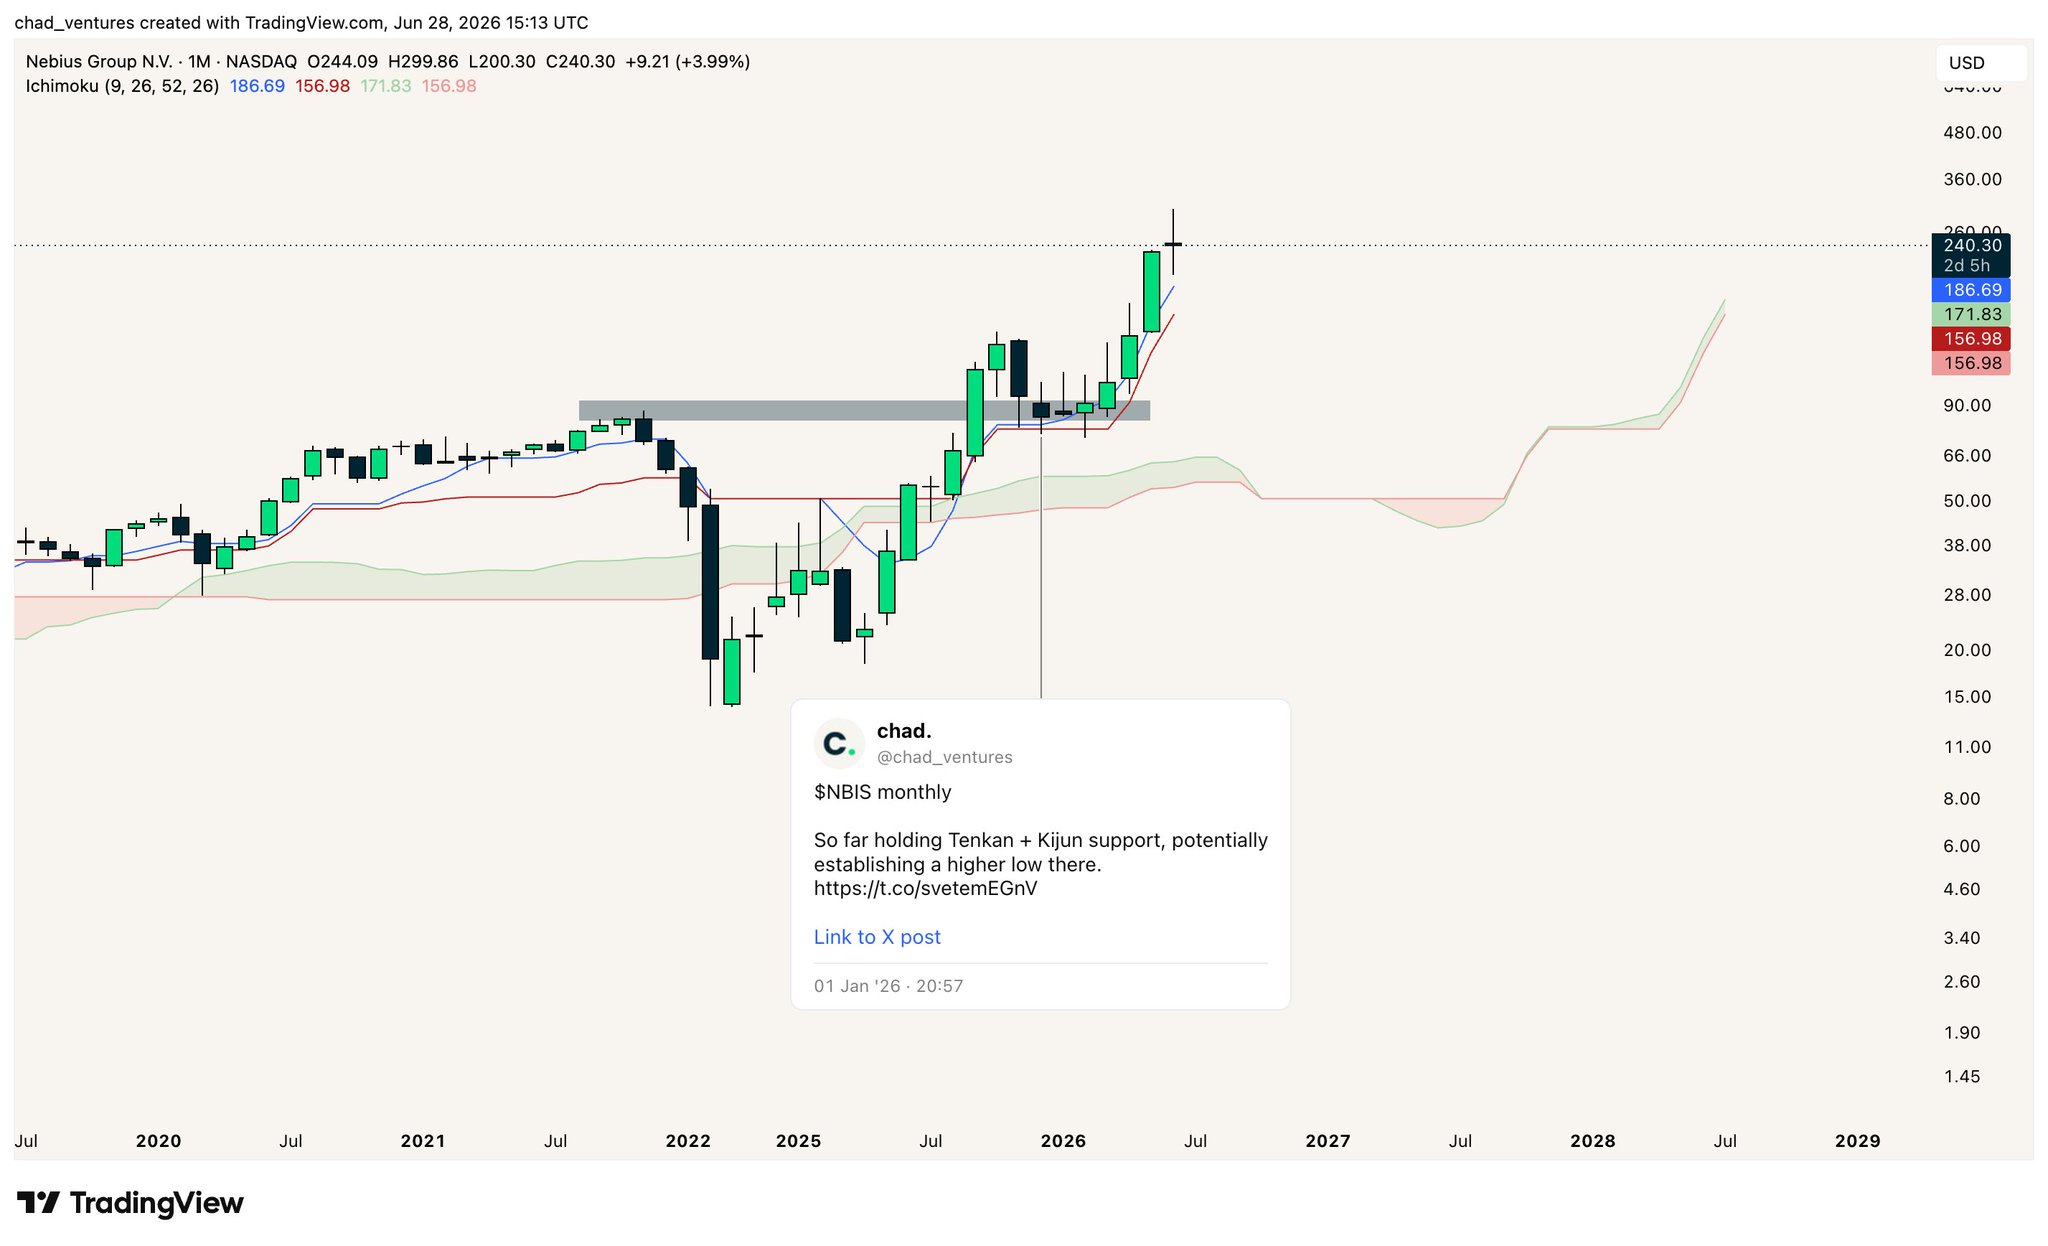
21.3K @chad_ventures Extremadamente alcista
NBIS stock is performing well, continuously holding monthly support, with potential to form higher lows.
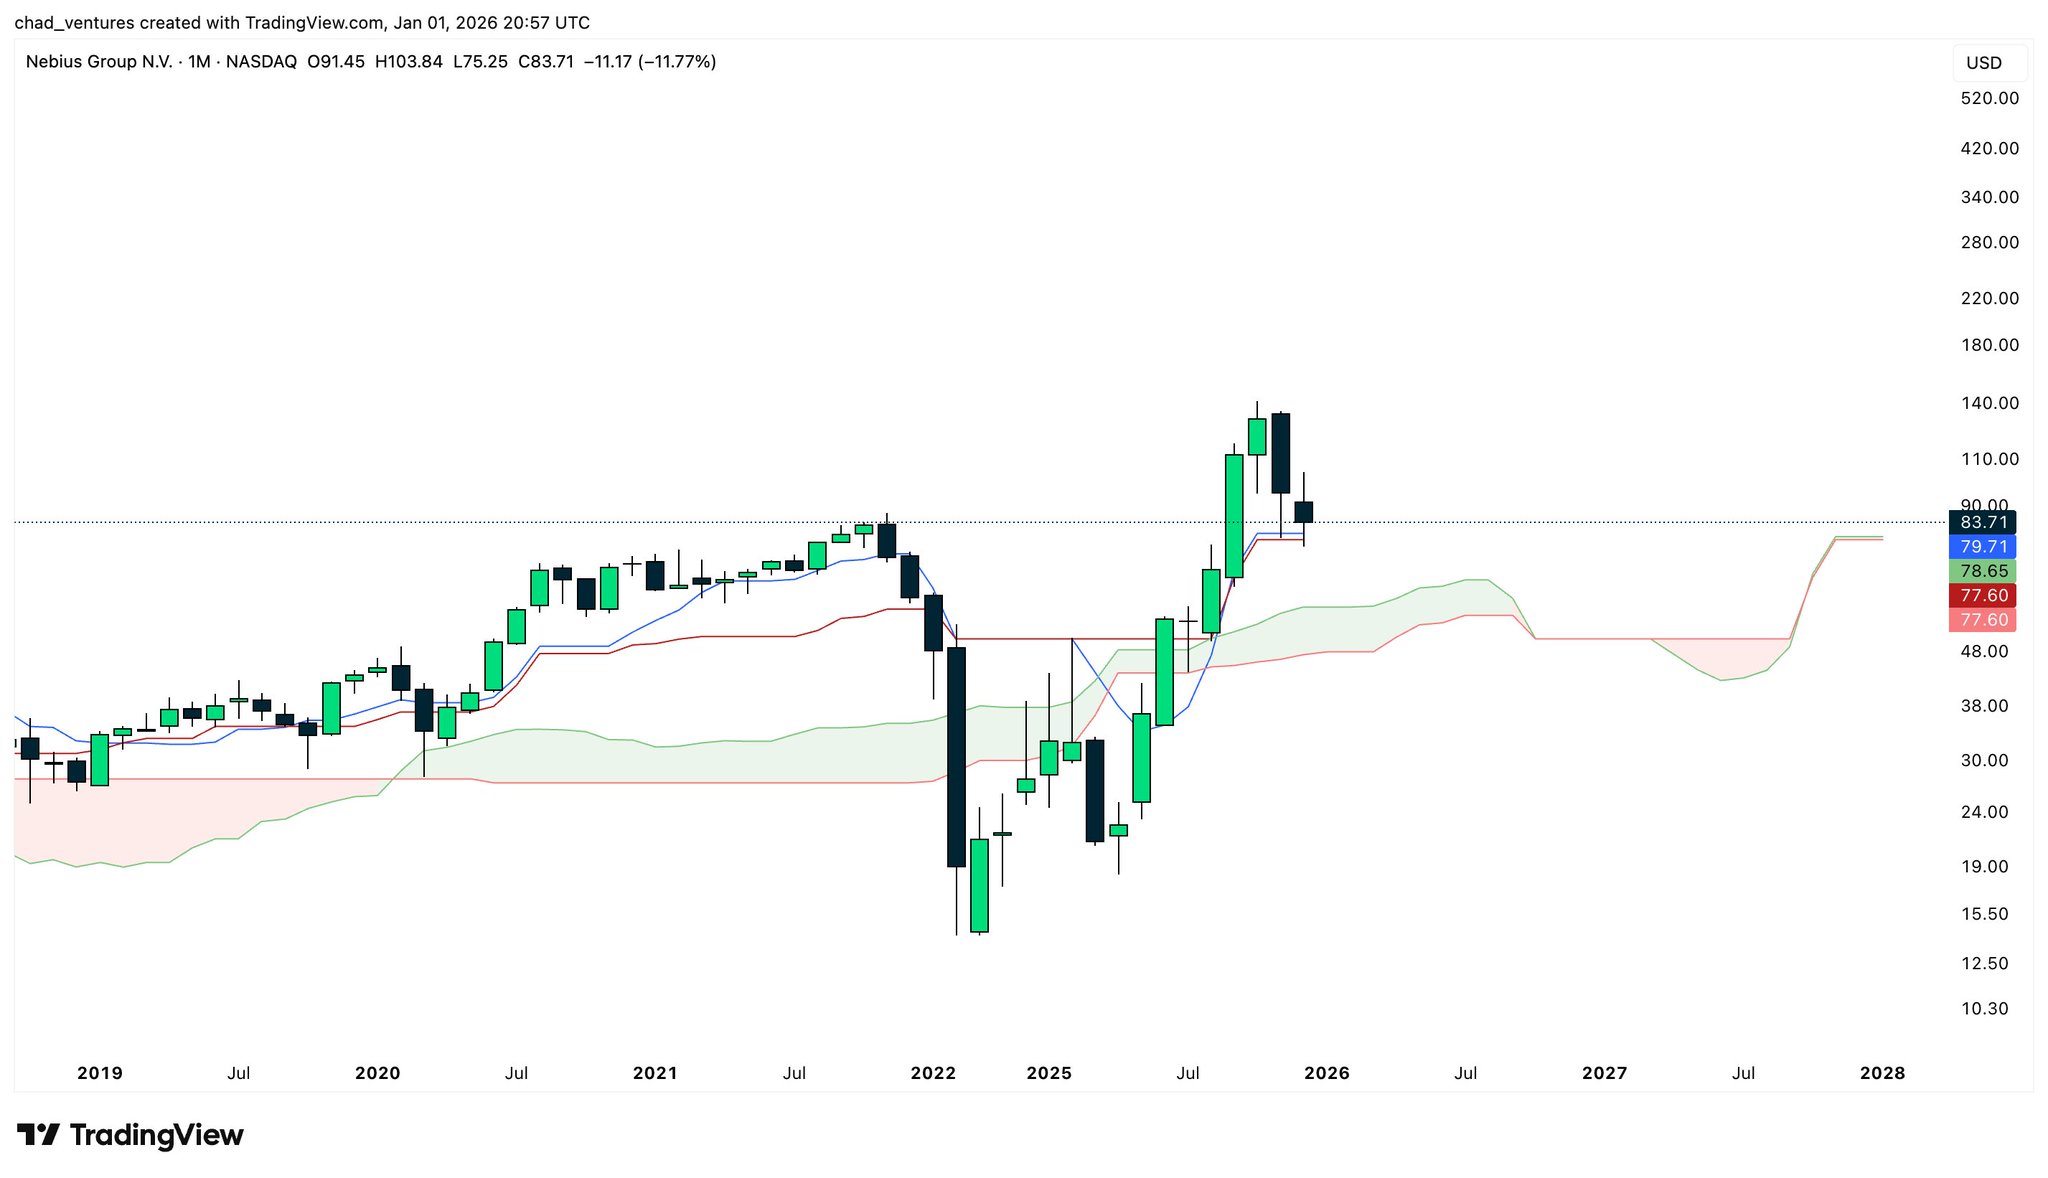
$NBIS my post around $80 in January aged pretty well.
Price held the monthly Tenkan + Kijun throughout the entire uptrend! https://t.co/lSF7obdzIn
chad.
TA_Analyst
Trader
B
21.3K @chad_ventures $NBIS monthly
So far holding Tenkan + Kijun support, potentially establishing a higher low there. https://t.co/svetemEGnV
 26
2
5.5K
26
2
5.5K
2026-06-28 15:17
Tendencia de NBIS tras el lanzamiento
Extremadamente alcista
NBIS stock is performing well, continuously holding monthly support, with potential to form higher lows.

Don’t Follow Shardi B If You Hate Money
Trader
TA_Analyst
C
251.3K @ShardiB2 Alcista
NBIS valuation low, projected demand surge 2026‑27, recommendation buy
Chad portfolio

MarketMaverick D
2.8K @MktMavPro $NBIS @leopoldasch Situational Awareness framework predicts an inflection point around 2026-2027 where compute demand goes vertical. If you believe that timeline, @nebiusai current valuation looks cheap against 2027-28 numbers. He’s buying the 2028 Nebius at a discount.
The size alone of his position shows conviction the market is still a full cycle behind on what neocloud revenue looks like when AGI workloads hit.
In summary; look where you’re going, not where you’re stepping. You haven’t seen shit yet… Prepare.
50
12
29.5K
2026-06-27 16:17
Tendencia de NBIS tras el lanzamiento
Alcista
NBIS valuation low, projected demand surge 2026‑27, recommendation buy
Predicción de precios
¿Cuándo es un buen momento para comprar NBIS? ¿Debería comprar o vender NBIS ahora?
Al decidir si es un buen momento para comprar o vender Nebius Group NV (Derivatives) (NBIS), es importante ajustarse primero a su propia estrategia de trading y perfil de riesgo. Los inversores a largo plazo y los traders a corto plazo suelen interpretar las condiciones del mercado de forma diferente, por lo que su decisión debe reflejar su enfoque personal. Según el último análisis técnico de 4 horas de NBIS, la señal de trading actual es Hold.

Predicción de Beacon
Pronóstico probabilístico de precios (próximas 24 horas)Descargo de responsabilidad de la predicción de Beacon
Los resultados de los datos que se muestran en esta página se analizan en función de los datos de trading reales (OHLCV) del par de trading seleccionado junto con los indicadores técnicos correspondientes.
Esta predicción es un producto técnico experimental y se proporciona solo con fines de referencia. No constituye un consejo de inversión. Los acontecimientos inesperados del mundo real pueden influir significativamente en el comportamiento del mercado. Por tanto, los traders deben tomar decisiones con precaución.
Esta predicción es un producto técnico experimental y se proporciona solo con fines de referencia. No constituye un consejo de inversión. Los acontecimientos inesperados del mundo real pueden influir significativamente en el comportamiento del mercado. Por tanto, los traders deben tomar decisiones con precaución.
Sobre Nebius Group NV (Derivatives)
Nebius Group NV (Derivatives) (NBIS) is a cryptocurrency . Nebius Group NV (Derivatives) has a current supply of 0. The last known price of Nebius Group NV (Derivatives) is 242.74101312 USD and is up 0.99 over the last 24 hours. It is currently trading on 43 active market(s) with $0.00 traded over the last 24 hours.
Leer más
Explorar más
BM Discovery


Nuevo listado

CIFRON Cipher Mining Inc.
-- 0.00%

WULFON TeraWulf Inc.
-- 0.00%

PINSON Pinterest, Inc.
-- 0.00%

HPEON Hewlett Packard Enterprise Co
-- 0.00%

PCGON PG&E
-- 0.00%

SOXLON Direxion Daily Semi Bull 3X ETF
-- 0.00%

NIOON NIO
-- 0.00%

HYGON iBoxx $ High Yield Corporate Bond ETF
-- 0.00%

AURON Aurora Innovation
-- 0.00%

IGVON iShares Expanded Tech-Software ETF
-- 0.00%