رشد کنید
Rewards
قرعهکشی روزانه
100% Chance To Win With Daily Trades
قرعهکشی روزانه اسپات
Win 8,888 USDT In Grand Prizes
افزایش اعتبار خط همراه
افزایش اعتبار خط همراه بهراحتی، آنلاین و ایمن
Send
Send money globally, fast and secure
BitMart Mall
Live on crypto

Arkham دادههای قیمت لحظهای
قیمت امروز Arkham برابر با $ 0.12 (ARKM/USD) است. با ارزش بازار برابر با $ 27.08M USD. حجم معاملات 24 ساعته $ 329.88K USD, تغییر قیمت 24 ساعته به میزان +2.98% و عرضه در گردش برابر با 225.10M ARKM.
Arkham ARKM تاریخچه قیمت USD
قیمت Arkham را برای امروز، 7 روز، 30 روز و 90 روز پیگیری کنید
دوره
تغییر
تغییر (%)
امروز
$ 0.0034
2.98%
7روزها
$ 0.012
-9.27%
30روزها
$ 0.041
-25.62%
90روزها
$ 0.019
19.27%
تجارت ARKM در سه مرحله
یک حساب کاربری رایگان ایجاد کنید، حساب خود را شارژ کنید، افزودن سپس ارز دیجیتال خود را انتخاب کنید
Arkham اطلاعات بازار
$ 0.11 محدوده ۲۴ ساعته $ 0.12
بالاترین رکورد زمانی
$ 3.99
همیشه پایین
$ 0.049
تغییر ۲۴ ساعته
2.98%
حجم ۲۴ ساعت
$ 329,879.74
عرضه در گردش
225.10M
ARKM
مارکت کپ
$ 27.08M
حداکثر عرضه
1.00B
ARKM
ارزش بازار کاملاً رقیقشده
$ 120.31M
معامله ARKM
کسب درآمد حتی بدون دانش مالی
Put your idle crypto to work and earn passive income through savings, staking, and more.
Arkham X Insight

GorkemCrypto
TA_Analyst
FA_Analyst
C
 185.0K @GorkemCrypto
 بسیار صعودی
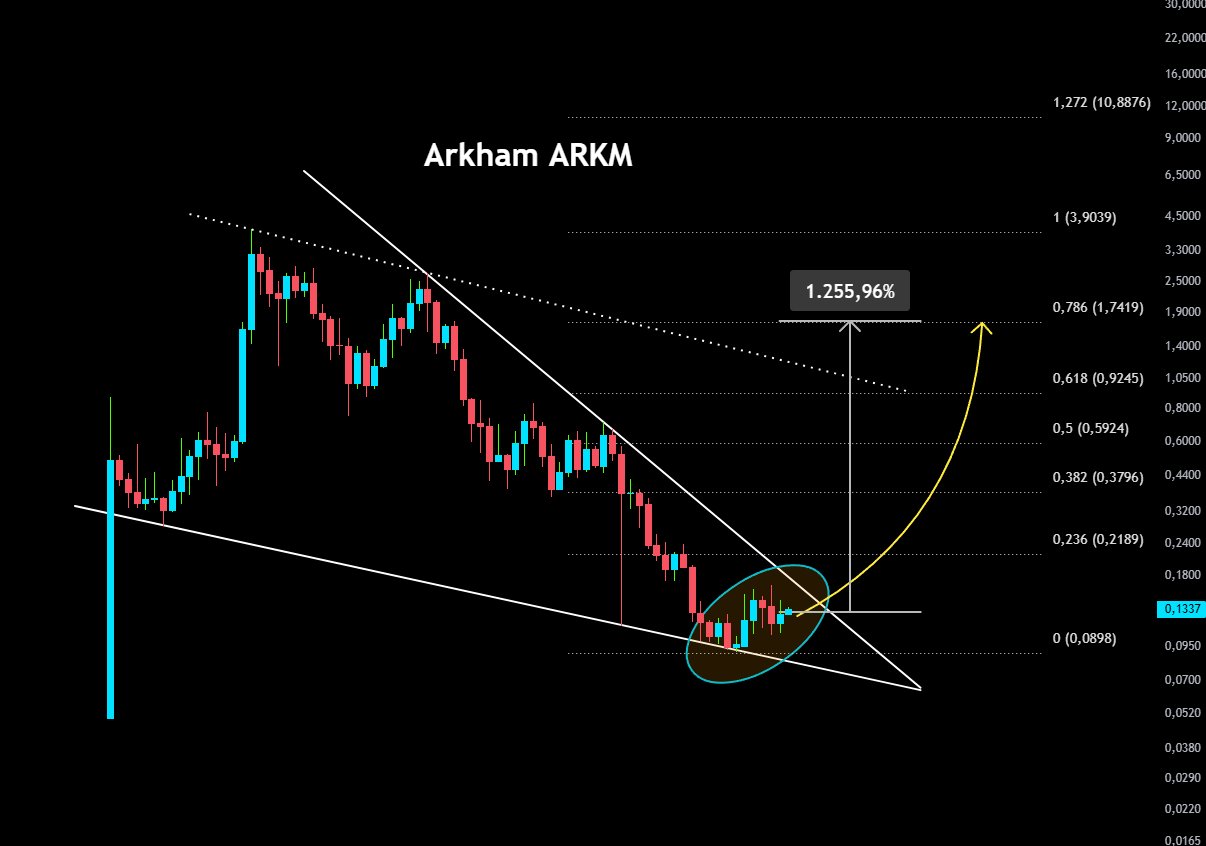
ARKM is expected to break the descending wedge, technical outlook bullish, target 1255% gain.
GorkemCrypto
TA_Analyst
FA_Analyst
C
185.0K @GorkemCrypto In the Arkham chart, it can be seen that the price is in the upward breakout stage of the descending wedge it has been moving within for a long time.
The area marked with a turquoise ring represents a critical reversal zone where the descending trend resistance is being challenged and the price is trying to hold at the 0.1337 level with buying pressure from dip levels.
If this breakout is confirmed with volume at the current 0.1337 level, it could completely end the downtrend in the pair and turn the technical outlook positive.
If the formation completes upward, the upper resistance levels in the direction of the yellow arrow, with a projected 1,255.96% rise potential, can be followed as a medium‑long‑term target according to the chart projection.
Do you think Arkham, with its strong positioning among AI and data analytics focused projects, could turn this critical wedge breakout into a major rally?
Meet in the comments.
#ARKM #Arkham #Crypto $ARKM
 284
284
 13
13
 13.3K
13.3K
2026-06-26 10:38
روند ARKM پس از انتشار
بسیار صعودی
ARKM is expected to break the descending wedge, technical outlook bullish, target 1255% gain.
GorkemCrypto
TA_Analyst
FA_Analyst
C
185.0K @GorkemCrypto بسیار صعودی
ARKM is on the edge of a descending wedge breakout, and if successful could have over 1200% upside potential.
GorkemCrypto
TA_Analyst
FA_Analyst
C
185.0K @GorkemCrypto In the Arkham chart, it can be seen that the price is in the upward breakout stage of the descending wedge it has been moving within for a long time.
The area marked with a turquoise ring represents a critical reversal zone where the descending trend resistance is being challenged and the price is trying to hold at the 0.1337 level with buying pressure from dip levels.
If this breakout is confirmed with volume at the current 0.1337 level, it could completely end the downtrend in the pair and turn the technical outlook positive.
If the formation completes upward, the upper resistance levels in the direction of the yellow arrow, with a projected 1,255.96% rise potential, can be followed as a medium‑long‑term target according to the chart projection.
Do you think Arkham, with its strong positioning among AI and data analytics focused projects, could turn this critical wedge breakout into a major rally?
Meet in the comments.
#ARKM #Arkham #Crypto $ARKM
284
13
13.3K
2026-06-24 10:38
روند ARKM پس از انتشار
بسیار صعودی
ARKM is on the edge of a descending wedge breakout, and if successful could have over 1200% upside potential.
GorkemCrypto
TA_Analyst
FA_Analyst
C
185.0K @GorkemCrypto بسیار صعودی
ARKM is expected to break the descending wedge, technical outlook bullish, target 1255% gain.
In the Arkham chart, it can be seen that the price is in the upward breakout stage of the descending wedge it has been moving within for a long time.
The area marked with a turquoise ring represents a critical reversal zone where the descending trend resistance is being challenged and the price is trying to hold at the 0.1337 level with buying pressure from dip levels.
If this breakout is confirmed with volume at the current 0.1337 level, it could completely end the downtrend in the pair and turn the technical outlook positive.
If the formation completes upward, the upper resistance levels in the direction of the yellow arrow, with a projected 1,255.96% rise potential, can be followed as a medium‑long‑term target according to the chart projection.
Do you think Arkham, with its strong positioning among AI and data analytics focused projects, could turn this critical wedge breakout into a major rally?
Meet in the comments.
#ARKM #Arkham #Crypto $ARKM
284
13
13.3K
2026-06-23 09:38
روند ARKM پس از انتشار
بسیار صعودی
ARKM is expected to break the descending wedge, technical outlook bullish, target 1255% gain.
پیشبینی قیمت
چه زمانی برای خرید ARKM مناسب است؟ آیا اکنون باید ARKM بخرم یا بفروشم؟
از دیدگاه تجزیه و تحلیل فنی بر اساس تحلیل تکنیکال 4 ساعته ARKM، سیگنال معاملاتی نگهداری است. بر اساس تحلیل تکنیکال 1 روزه ARKM، سیگنال معاملاتی نگهداری است.

پیشبینی Beacon
پیشبینی احتمالی قیمت (24 ساعت آینده)اطلاعیه
بازارهای پیشبینی ذاتاً نوسانپذیر هستند. قیمت واقعی تراکنش ممکن است با قیمت نمایش دادهشده متفاوت باشد و پرداخت نهایی طبق قوانین تسویه پلتفرم تعیین میشود.
درباره Arkham
Arkham (ARKM) is a cryptocurrency and operates on the Ethereum platform. Arkham has a current supply of 1,000,000,000 with 225,100,000 in circulation. The last known price of Arkham is 0.13303487 USD and is down -0.37 over the last 24 hours. It is currently trading on 265 active market(s) with $22,341,033.98 traded over the last 24 hours. More information can be found at https://arkm.com/.
بیشتر بخوانید
کاوش بیشتر
کشف BM


لیستینگ جدید

SOXLON Direxion Daily Semi Bull 3X ETF
-- 0.00%

NIOON NIO
-- 0.00%

HYGON iBoxx $ High Yield Corporate Bond ETF
-- 0.00%

AURON Aurora Innovation
-- 0.00%

IGVON iShares Expanded Tech-Software ETF
-- 0.00%

SQQQON ProShares UltraPro Short QQQ
-- 0.00%

IBITON iShares Bitcoin Trust ETF
-- 0.00%

AMCON AMC Entertainment Holdings
-- 0.00%

GRABON Grab Holdings
-- 0.00%

SNAPON Snap(Ondo)
-- 0.00%
بخرید ARKM
معامله ARKM