Acheter des cryptomonnaies
carte
P2P Trading
Achetez des USDT sur la marketplace
Carte bancaire
Achetez des cryptomonnaies avec une carte Visa ou Mastercard
Paiement par un tiers
Buy des crypto via MoonPay, Simplex et plus
BitMart Card
Dynamisez vos investissements dans les cryptos
Carte prépayée crypto
Obtenez instantanément une Mastercard prête à l'emploi
Échanger
Spot
Négociez des cryptomonnaies rapidement et de manière professionnelle
BM Discovery
La plateforme de découverte d'actifs On-Chain la plus rapide
DEX
bêta
La solution la plus simple pour trader en chaîne.
Marge
5x
Augmentez vos profits grâce à l'effet de levier
Pré-marché
Planifiez à l'avance, saisissez l'opportunité
USDⓈ-M
En utilisant USDⓈ comme garantie
COIN-M
Utiliser la cryptomonnaie elle-même comme garantie
TradFi
Un guichet unique pour les métaux, les actions et le forex
Démo de trading
Apprenez à trade sans risque
Aperçu des contrats à terme
Une plateforme unique pour tout ce qui concerne les contrats à terme
Futures King
Cagnotte de 478 000 USDT
Augmenter
Aperçu des gains
Actifs inactifs, obtenez des rendements en toute simplicité
Épargne
Gagnez des intérêts grâce à vos avoirs.
Staking
Staking facile, récompenses élevées
Gestion de patrimoine
Développez votre patrimoine avec une équipe d'actifs de premier ordre Top
RWA
Conservez le BMRUSD et profitez du rendement
Offre exclusive pour les VIP
Gagner en toute sécurité pour les utilisateurs VIP
Rewards
Centre de récompenses
Découvrez des récompenses exclusives d'une valeur allant jusqu'à 14 000 USDT
Lancement Prime
Une plateforme de lancement de jetons et NFT
Programme d'affiliation
Rejoignez-nous pour profiter de commissions élevées
Powerdrop
La solution airdrop de nouvelle génération est DISPONIBLE !
Centre des événements
Le guichet unique pour toutes les opérations commerciales
Tirage au sort quotidien futures
100% de chances de gagner avec les tradings quotidiens
Tirage quotidien Spot
Gagnez 8 888 USDT en grands prix
Staker pour voter
Gagnez des airdrops en votant
Institution
Des services professionnels et exclusifs
VIP
Débloquez des récompenses exclusives
Académie
Tout ce que vous devez savoir sur le trading et la blockchain.
Stage chez BitMart
Commencez votre carrière en crypto ici
Bitmart Travel
Services de voyage mondiaux One-Stop
INO
Une plateforme de lancement de NFT
Stake BMX pour le listing
Partager les frais de transaction
APIS
Une stabilité fiable et de nombreux points de terminaison
Programme de courtier
Gagnez des commissions grâce à l'intégration d'API
Actualités
Dernières actualités et derniers points de vue
MARKETPLACE NFT
Une marketplace NFT unique en son genre
Recharge mobile Top
Rechargez vos téléphones portables facilement, online, en toute sécurité
Send
Send money globally, fast and secure
BitMart Mall
Événement en direct sur les cryptomonnaies

Nebius Group NV (Derivatives) (NBIS)
$ 261.89 (NBIS/USD)
7.51%
24H
Nebius Group NV (Derivatives) NBIS Historique des prix USD
Suivez le prix de Nebius Group NV (Derivatives) aujourd’hui, dans 7 jours, 30 jours et 90 jours
Période
Modifier
Variation (en pourcentage)
Aujourd'hui
$ 18.29
7.51%
7Jours
$ 38.22
-13.40%
30Jours
$ 11.61
4.93%
90Jours
$ 11.61
4.93%
Possédez NBIS dès maintenant
Achetez et vendez NBIS facilement et en toute sécurité sur BitMart.
Nebius Group NV (Derivatives) Informations sur le marché
$ 235.90 Fourchette de prix sur 24 heures $ 260.65
Record absolu
$ 297.52
Plus bas niveau jamais atteint
$ 201.05
Variation sur 24 heures
7.51%
Volume sur 24 h
$ 0
Approvisionnement en circulation
0.00
NBIS
Capitalisation boursière
$ 0
Approvisionnement maximal
--
Capitalisation boursière entièrement diluée
$ 0
Trader NBIS
Gagner
Faites fructifier vos cryptomonnaies et générez des revenus passifs grâce à l'épargne, au staking, et plus encore.
Nebius Group NV (Derivatives) X Insight

Yimin X
Quant
FA_Analyst
B
 14.5K @yxinsights
 Haussier
NBIS is supported at $252.56, showing a short-term rebound trend.

Ace D
5.4K @acethebulllly $NBIS continues building a constructive intraday recovery as buyers absorb pullbacks and steadily reclaim higher prices while overhead liquidity limits immediate upside beneath the 5.56K ask wall at $260.01. Price trades at $252.56 as bid support continues absorbing sell pressure, and holding above the larger liquidity clusters keeps short-term momentum favoring buyers while a break through overhead supply opens the path for further expansion.
Resistance:
• $257.99 — 3.68K ask
• $260.01 — 5.56K ask
• $262.01 — 3.12K ask
Support:
• $252.56 — 15.91K bid
• $246.99 — 6.32K bid
• $243.01 — 4.65K bid
 7
7
 17
17
 1.0K
1.0K
2026-06-29 16:37
Tendance de NBIS après le lancement
Haussier
NBIS is supported at $252.56, showing a short-term rebound trend.

chad.
TA_Analyst
Trader
B
21.3K @chad_ventures Extrêmement haussier
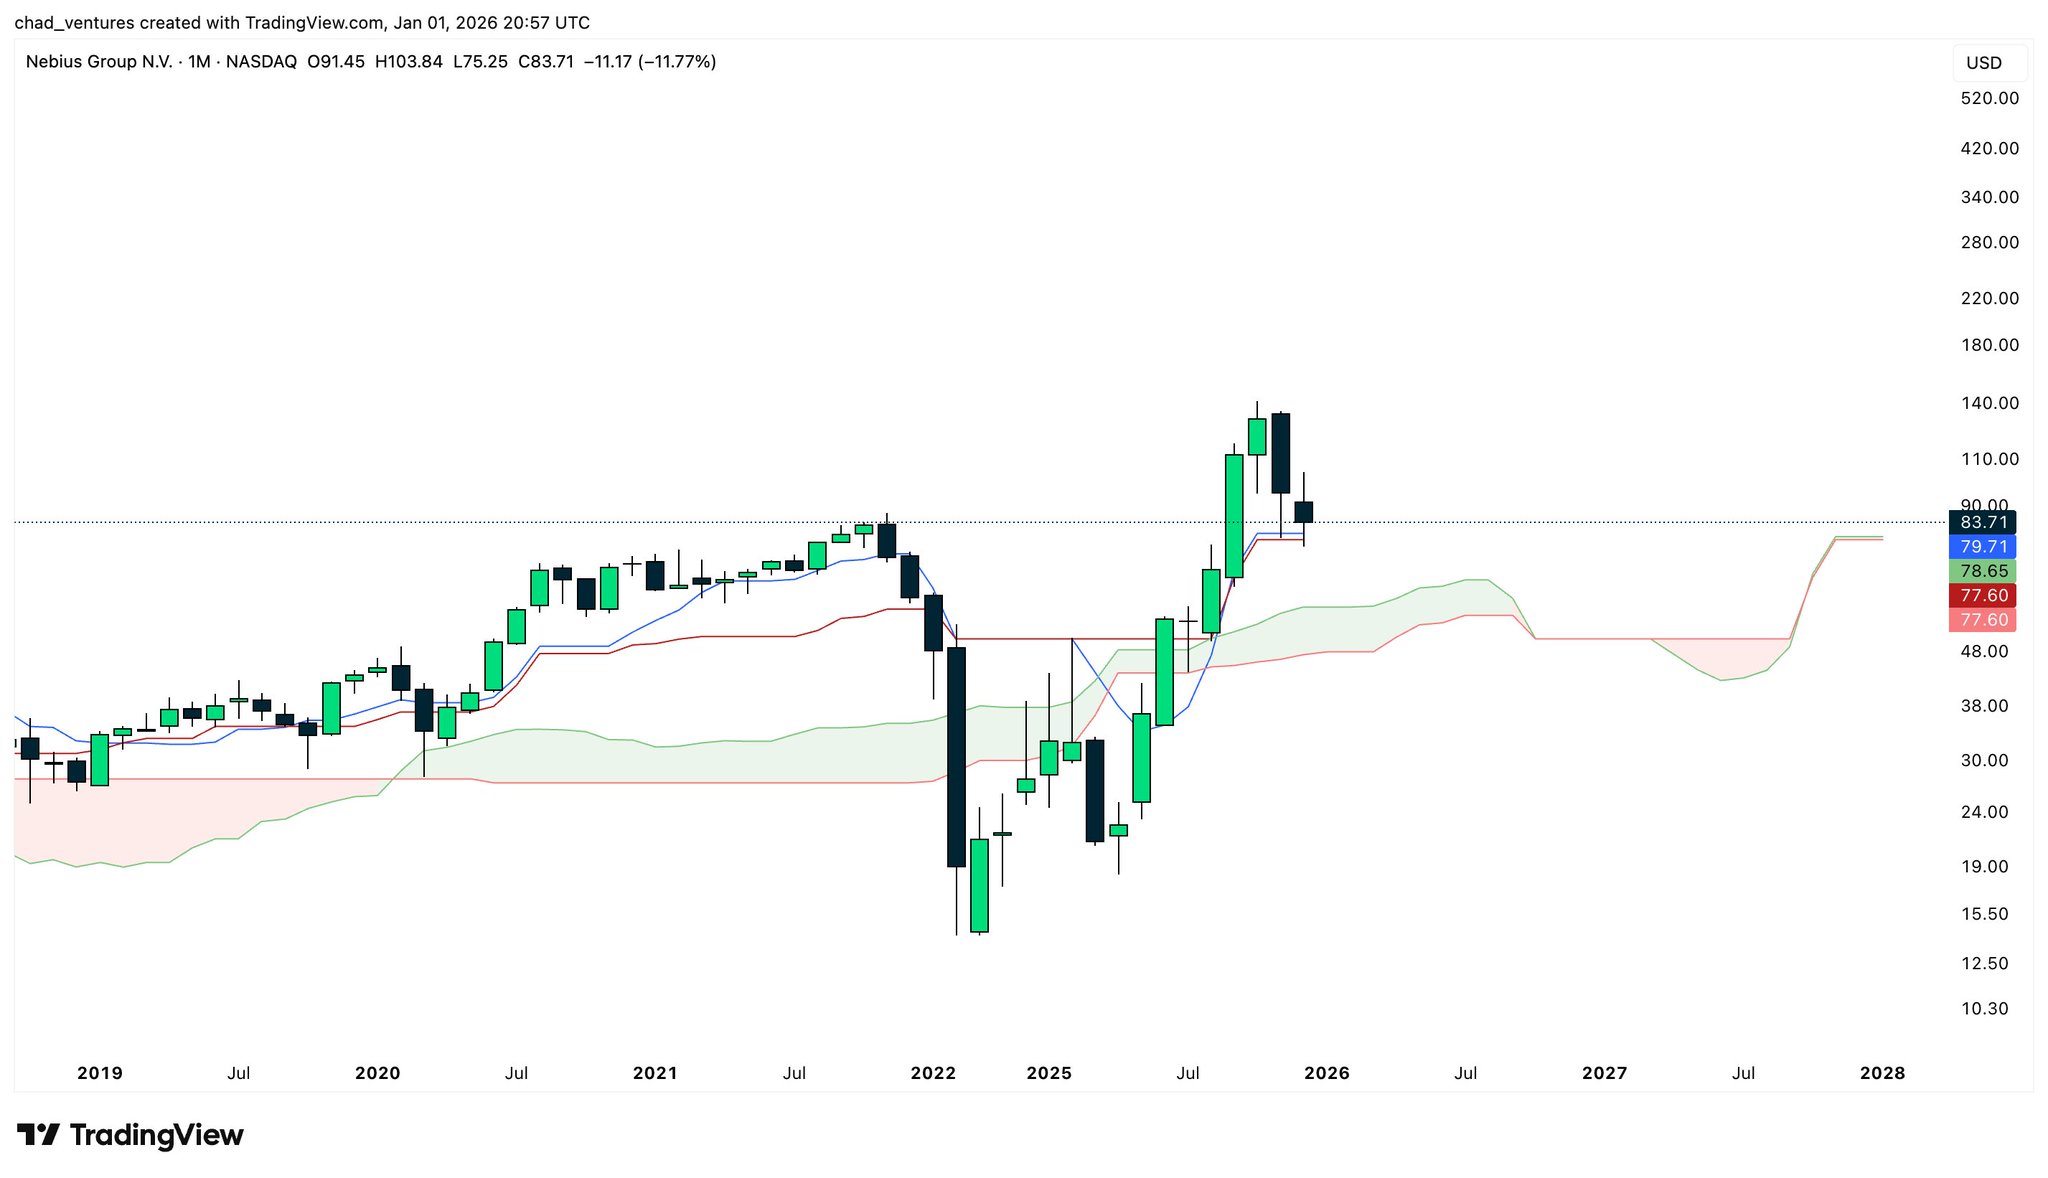
NBIS stock is performing well, continuously holding monthly support, with potential to form higher lows.
$NBIS my post around $80 in January aged pretty well.
Price held the monthly Tenkan + Kijun throughout the entire uptrend! https://t.co/lSF7obdzIn
chad.
TA_Analyst
Trader
B
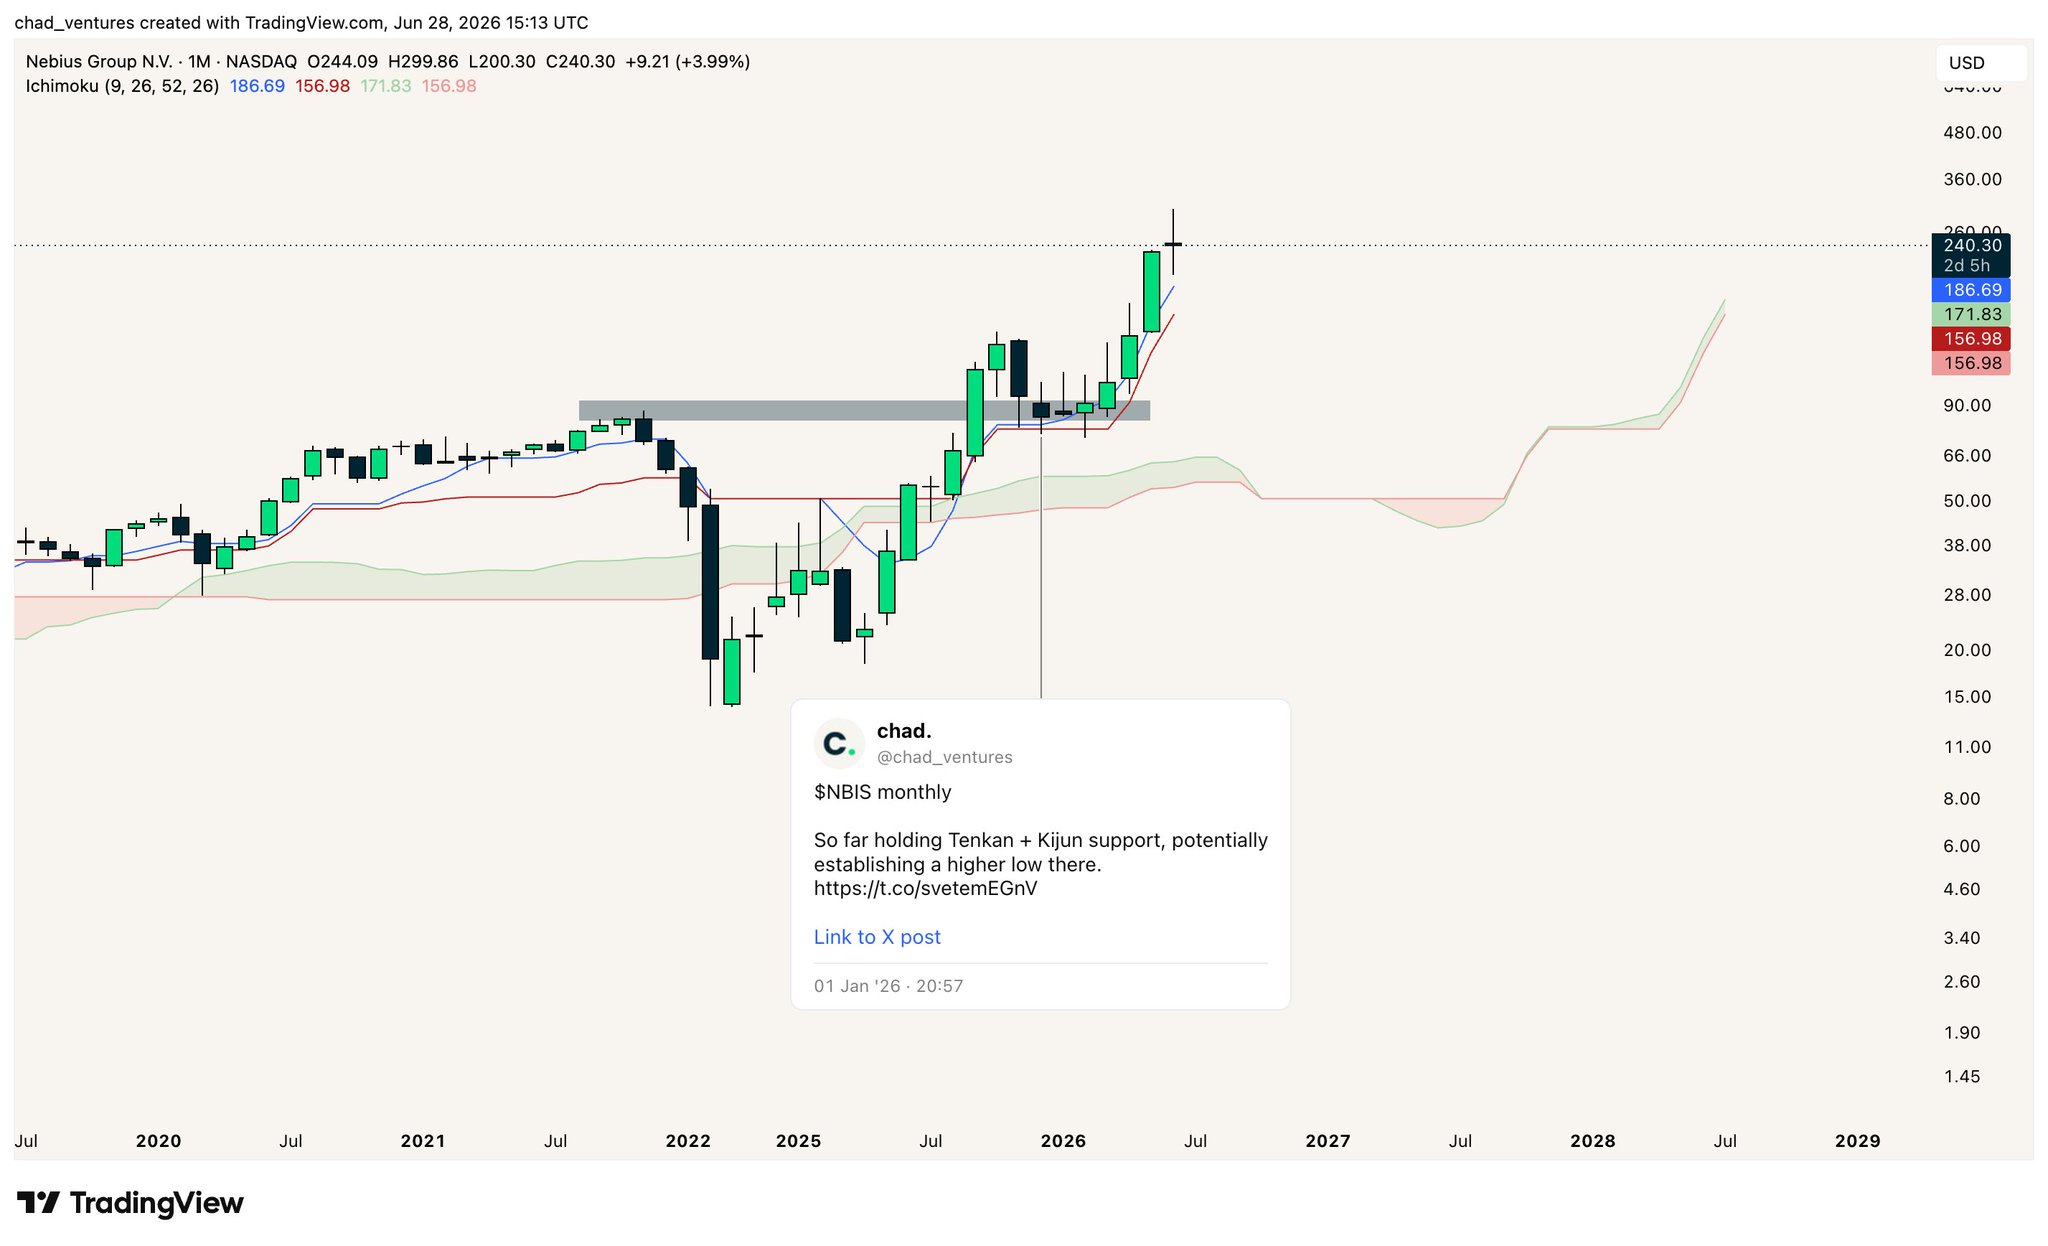
21.3K @chad_ventures $NBIS monthly
So far holding Tenkan + Kijun support, potentially establishing a higher low there. https://t.co/svetemEGnV
 26
2
5.5K
26
2
5.5K
2026-06-28 15:17
Tendance de NBIS après le lancement
Extrêmement haussier
NBIS stock is performing well, continuously holding monthly support, with potential to form higher lows.

Don’t Follow Shardi B If You Hate Money
Trader
TA_Analyst
C
251.3K @ShardiB2 Haussier
NBIS valuation low, projected demand surge 2026‑27, recommendation buy
Chad portfolio

MarketMaverick D
2.8K @MktMavPro $NBIS @leopoldasch Situational Awareness framework predicts an inflection point around 2026-2027 where compute demand goes vertical. If you believe that timeline, @nebiusai current valuation looks cheap against 2027-28 numbers. He’s buying the 2028 Nebius at a discount.
The size alone of his position shows conviction the market is still a full cycle behind on what neocloud revenue looks like when AGI workloads hit.
In summary; look where you’re going, not where you’re stepping. You haven’t seen shit yet… Prepare.
50
12
29.5K
2026-06-27 16:17
Tendance de NBIS après le lancement
Haussier
NBIS valuation low, projected demand surge 2026‑27, recommendation buy
Prévision de prix
Quel est le meilleur moment pour acheter NBIS? Dois-je acheter ou vendre NBIS maintenant ?
Pour déterminer s'il est opportun d'acheter ou de vendre Nebius Group NV (Derivatives) (NBIS), il est important de commencer par s'aligner sur sa propre stratégie de trading et son profil de risque. Les investisseurs à long terme et les traders à court terme interprètent souvent les conditions du marché différemment, votre décision doit donc refléter votre approche personnelle. Selon la dernière analyse technique NBIS de 4 heures, le signal de trading actuel est Tenez.

Prédiction de Beacon
Prévision probabiliste des prix (Prochaines 24 heures)Avertissement de prédiction de Beacon
Les résultats affichés sur cette page sont analysés sur la base des données de trading réelles (OHLCV) de la paire de trading sélectionnée ainsi que des indicateurs techniques correspondants.
Cette prédiction est un produit technique expérimental et est fournie uniquement à titre de référence. Ceci ne constitue pas un conseil en investissement. Des événements inattendus du monde réel peuvent avoir un impact significatif sur le comportement du marché. Les traders doivent prendre des décisions avec prudence.
Cette prédiction est un produit technique expérimental et est fournie uniquement à titre de référence. Ceci ne constitue pas un conseil en investissement. Des événements inattendus du monde réel peuvent avoir un impact significatif sur le comportement du marché. Les traders doivent prendre des décisions avec prudence.
À propos Nebius Group NV (Derivatives)
Nebius Group NV (Derivatives) (NBIS) is a cryptocurrency . Nebius Group NV (Derivatives) has a current supply of 0. The last known price of Nebius Group NV (Derivatives) is 242.74101312 USD and is up 0.99 over the last 24 hours. It is currently trading on 43 active market(s) with $0.00 traded over the last 24 hours.
En savoir plus
En savoir plus
BM Discovery


Nouvelle annonce

CIFRON Cipher Mining Inc.
-- 0.00%

WULFON TeraWulf Inc.
-- 0.00%

PINSON Pinterest, Inc.
-- 0.00%

HPEON Hewlett Packard Enterprise Co
-- 0.00%

PCGON PG&E
-- 0.00%

SOXLON Direxion Daily Semi Bull 3X ETF
-- 0.00%

NIOON NIO
-- 0.00%

HYGON iBoxx $ High Yield Corporate Bond ETF
-- 0.00%

AURON Aurora Innovation
-- 0.00%

IGVON iShares Expanded Tech-Software ETF
-- 0.00%