Rewards
Futures Daily Draw
100% Chance To Win With Daily Trades
現物の日次のドロー
Win 8,888 USDT In Grand Prizes
ステークして投票
投票してエアドロップを獲得
機関
プロなかつ専門的なサービス対応
BitMart VIP
限定報酬のロック解除
アカデミー
トレードとブロックチェーンについて
BitMart Internship
Start your Crypto Career Here
BitMart Travel
ワンストップグローバルトラベルサービス
モバイルチャージ
モバイルを簡単に、オンラインで、安全にチャージ
Send
Send money globally, fast and secure
BitMartモール
Live on crypto

Arkham ライブ価格データ
Arkhamの今日の価格は$ 0.11 (ARKM/USD)です。 時価総額$ 26.98M USD、 24時間取引量$ 329.67K USD、 24時間の価格変動+2.84%、 そして流通供給量225.10M ARKM。
Arkham ARKM 価格履歴 USD
Arkhamの今日、7日間、30日間、90日間の価格を追跡
期間
24H変動幅
24H変動率 (%)
本日
$ 0.0029
2.56%
7日
$ 0.012
-9.65%
30日
$ 0.041
-25.93%
90日
$ 0.018
18.78%
ARKMを今すぐ所有
BitMartでARKMを簡単に安全に売買できます。
Arkham 相場情報
$ 0.11 24H変動幅 $ 0.12
過去最高値
$ 3.99
過去最安値
$ 0.049
24H変動幅
2.84%
24H取引高
$ 329,672.68
供給量
225.10M
ARKM
時価総額
$ 26.98M
最大供給量
1.00B
ARKM
完全希薄化後時価総額
$ 119.84M
取引 ARKM

Arkham Xインサイト

GorkemCrypto
TA_Analyst
FA_Analyst
C
 185.0K @GorkemCrypto
 非常に強気
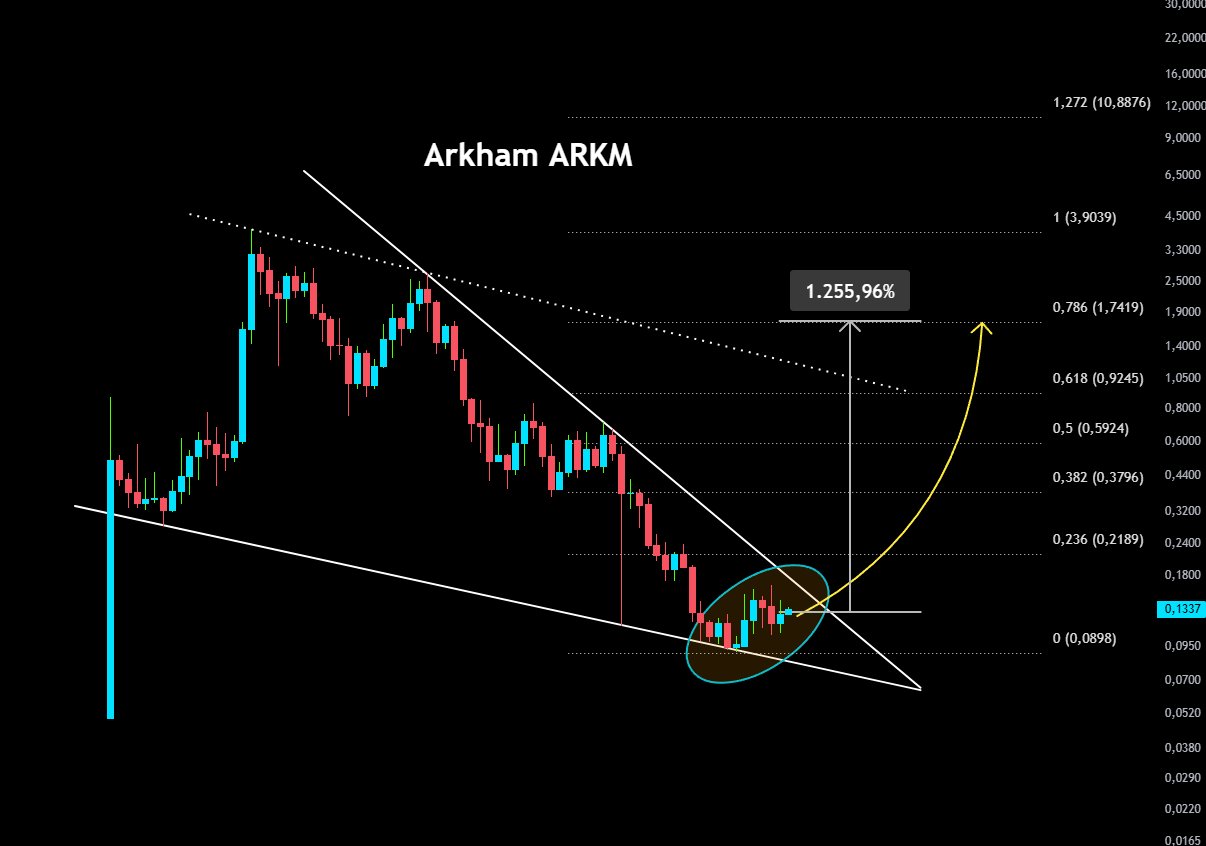
ARKM is expected to break the descending wedge, technical outlook bullish, target 1255% gain.
GorkemCrypto
TA_Analyst
FA_Analyst
C
185.0K @GorkemCrypto In the Arkham chart, it can be seen that the price is in the upward breakout stage of the descending wedge it has been moving within for a long time.
The area marked with a turquoise ring represents a critical reversal zone where the descending trend resistance is being challenged and the price is trying to hold at the 0.1337 level with buying pressure from dip levels.
If this breakout is confirmed with volume at the current 0.1337 level, it could completely end the downtrend in the pair and turn the technical outlook positive.
If the formation completes upward, the upper resistance levels in the direction of the yellow arrow, with a projected 1,255.96% rise potential, can be followed as a medium‑long‑term target according to the chart projection.
Do you think Arkham, with its strong positioning among AI and data analytics focused projects, could turn this critical wedge breakout into a major rally?
Meet in the comments.
#ARKM #Arkham #Crypto $ARKM
 284
284
 13
13
 13.3K
13.3K
2026-06-26 10:38
リリース後のARKMのトレンド
非常に強気
ARKM is expected to break the descending wedge, technical outlook bullish, target 1255% gain.
GorkemCrypto
TA_Analyst
FA_Analyst
C
185.0K @GorkemCrypto 非常に強気
ARKM is on the edge of a descending wedge breakout, and if successful could have over 1200% upside potential.
GorkemCrypto
TA_Analyst
FA_Analyst
C
185.0K @GorkemCrypto In the Arkham chart, it can be seen that the price is in the upward breakout stage of the descending wedge it has been moving within for a long time.
The area marked with a turquoise ring represents a critical reversal zone where the descending trend resistance is being challenged and the price is trying to hold at the 0.1337 level with buying pressure from dip levels.
If this breakout is confirmed with volume at the current 0.1337 level, it could completely end the downtrend in the pair and turn the technical outlook positive.
If the formation completes upward, the upper resistance levels in the direction of the yellow arrow, with a projected 1,255.96% rise potential, can be followed as a medium‑long‑term target according to the chart projection.
Do you think Arkham, with its strong positioning among AI and data analytics focused projects, could turn this critical wedge breakout into a major rally?
Meet in the comments.
#ARKM #Arkham #Crypto $ARKM
284
13
13.3K
2026-06-24 10:38
リリース後のARKMのトレンド
非常に強気
ARKM is on the edge of a descending wedge breakout, and if successful could have over 1200% upside potential.
GorkemCrypto
TA_Analyst
FA_Analyst
C
185.0K @GorkemCrypto 非常に強気
ARKM is expected to break the descending wedge, technical outlook bullish, target 1255% gain.
In the Arkham chart, it can be seen that the price is in the upward breakout stage of the descending wedge it has been moving within for a long time.
The area marked with a turquoise ring represents a critical reversal zone where the descending trend resistance is being challenged and the price is trying to hold at the 0.1337 level with buying pressure from dip levels.
If this breakout is confirmed with volume at the current 0.1337 level, it could completely end the downtrend in the pair and turn the technical outlook positive.
If the formation completes upward, the upper resistance levels in the direction of the yellow arrow, with a projected 1,255.96% rise potential, can be followed as a medium‑long‑term target according to the chart projection.
Do you think Arkham, with its strong positioning among AI and data analytics focused projects, could turn this critical wedge breakout into a major rally?
Meet in the comments.
#ARKM #Arkham #Crypto $ARKM
284
13
13.3K
2026-06-23 09:38
リリース後のARKMのトレンド
非常に強気
ARKM is expected to break the descending wedge, technical outlook bullish, target 1255% gain.
価格予測
ARKMを購入するのに良い時期はいつですか?ARKMは今買いでしょうか、売りでしょうか?
Arkham(ARKM)を購入または売却する適切な時期を決定する際は、まずご自身の取引戦略とリスクプロファイルに合わせることが重要です。長期投資家と短期トレーダーは市場状況を異なる方法で解釈することが多いため、決定には個人的なアプローチを反映すべきです。 最新の ARKM 4時間テクニカル分析によると、現在の取引シグナルは ホールド です。 最新のARKM1日テクニカル分析によると、現在のシグナルはホールドです。

ビーコン予測
の確率的価格予測(今後24時間)ビーコン予測に関する免責事項
このページに表示されるデータ結果は、選択した取引ペアの実際の取引データ(OHLCV)と対応するテクニカル指標に基づいて分析されています。
この予測は実験的な技術的成果であり、あくまで参考目的で提供しています。これは投資アドバイスをではありません。現実世界での予期せぬ出来事が市場行動に大きな影響を与える可能性があります。トレーダーは慎重に意思決定を行うべきです。
この予測は実験的な技術的成果であり、あくまで参考目的で提供しています。これは投資アドバイスをではありません。現実世界での予期せぬ出来事が市場行動に大きな影響を与える可能性があります。トレーダーは慎重に意思決定を行うべきです。
アプリバージョン Arkham
Arkham (ARKM) is a cryptocurrency and operates on the Ethereum platform. Arkham has a current supply of 1,000,000,000 with 225,100,000 in circulation. The last known price of Arkham is 0.13303487 USD and is down -0.37 over the last 24 hours. It is currently trading on 265 active market(s) with $22,341,033.98 traded over the last 24 hours. More information can be found at https://arkm.com/.
続きを読む
さらに詳しく
BM Discovery


新規上場

SOXLON Direxion Daily Semi Bull 3X ETF
-- 0.00%

NIOON NIO
-- 0.00%

HYGON iBoxx $ High Yield Corporate Bond ETF
-- 0.00%

AURON Aurora Innovation
-- 0.00%

IGVON iShares Expanded Tech-Software ETF
-- 0.00%

SQQQON ProShares UltraPro Short QQQ
-- 0.00%

IBITON iShares Bitcoin Trust ETF
-- 0.00%

AMCON AMC Entertainment Holdings
-- 0.00%

GRABON Grab Holdings
-- 0.00%

SNAPON Snap(Ondo)
-- 0.00%
購入 ARKM
取引 ARKM