Rewards
Futures Daily Draw
100% Chance To Win With Daily Trades
現物の日次のドロー
Win 8,888 USDT In Grand Prizes
ステークして投票
投票してエアドロップを獲得
機関
プロなかつ専門的なサービス対応
BitMart VIP
限定報酬のロック解除
アカデミー
トレードとブロックチェーンについて
BitMart Internship
Start your Crypto Career Here
BitMart Travel
ワンストップグローバルトラベルサービス
モバイルチャージ
モバイルを簡単に、オンラインで、安全にチャージ
Send
Send money globally, fast and secure
BitMartモール
Live on crypto

Frax (prev. FXS) (FRAX)
$ 0.23 (FRAX/USD)
0.00%
24H
Frax (prev. FXS) ライブ価格データ
Frax (prev. FXS)の今日の価格は$ 0.23 (FRAX/USD)です。 時価総額$ 22.43M USD、 24時間取引量$ 417.44K USD、 24時間の価格変動+0.00%、 そして流通供給量93.60M FRAX。
Frax (prev. FXS) FRAX 価格履歴 USD
Frax (prev. FXS)の今日、7日間、30日間、90日間の価格を追跡
期間
24H変動幅
24H変動率 (%)
本日
$ 0
0.00%
7日
$ 0.019
-7.69%
30日
$ 0.15
-40.00%
90日
$ 0.16
-41.46%
FRAXを今すぐ所有
BitMartでFRAXを簡単に安全に売買できます。
Frax (prev. FXS) 相場情報
$ 0.22 24H変動幅 $ 0.23
過去最高値
$ 1.47
過去最安値
$ 0.22
24H変動幅
0.00%
24H取引高
$ 417,443.06
供給量
93.59M
FRAX
時価総額
$ 22.43M
最大供給量
99.68M
FRAX
完全希薄化後時価総額
$ 23.89M
取引 FRAX

Frax (prev. FXS) Xインサイト

captnhayz ¤
DeFi_Expert
Community_Lead
B
 3.3K @captnhayz
 中立
FRAX is consolidating in the $0.22-$0.26 range, awaiting a breakout to determine the next direction.

Charmander D
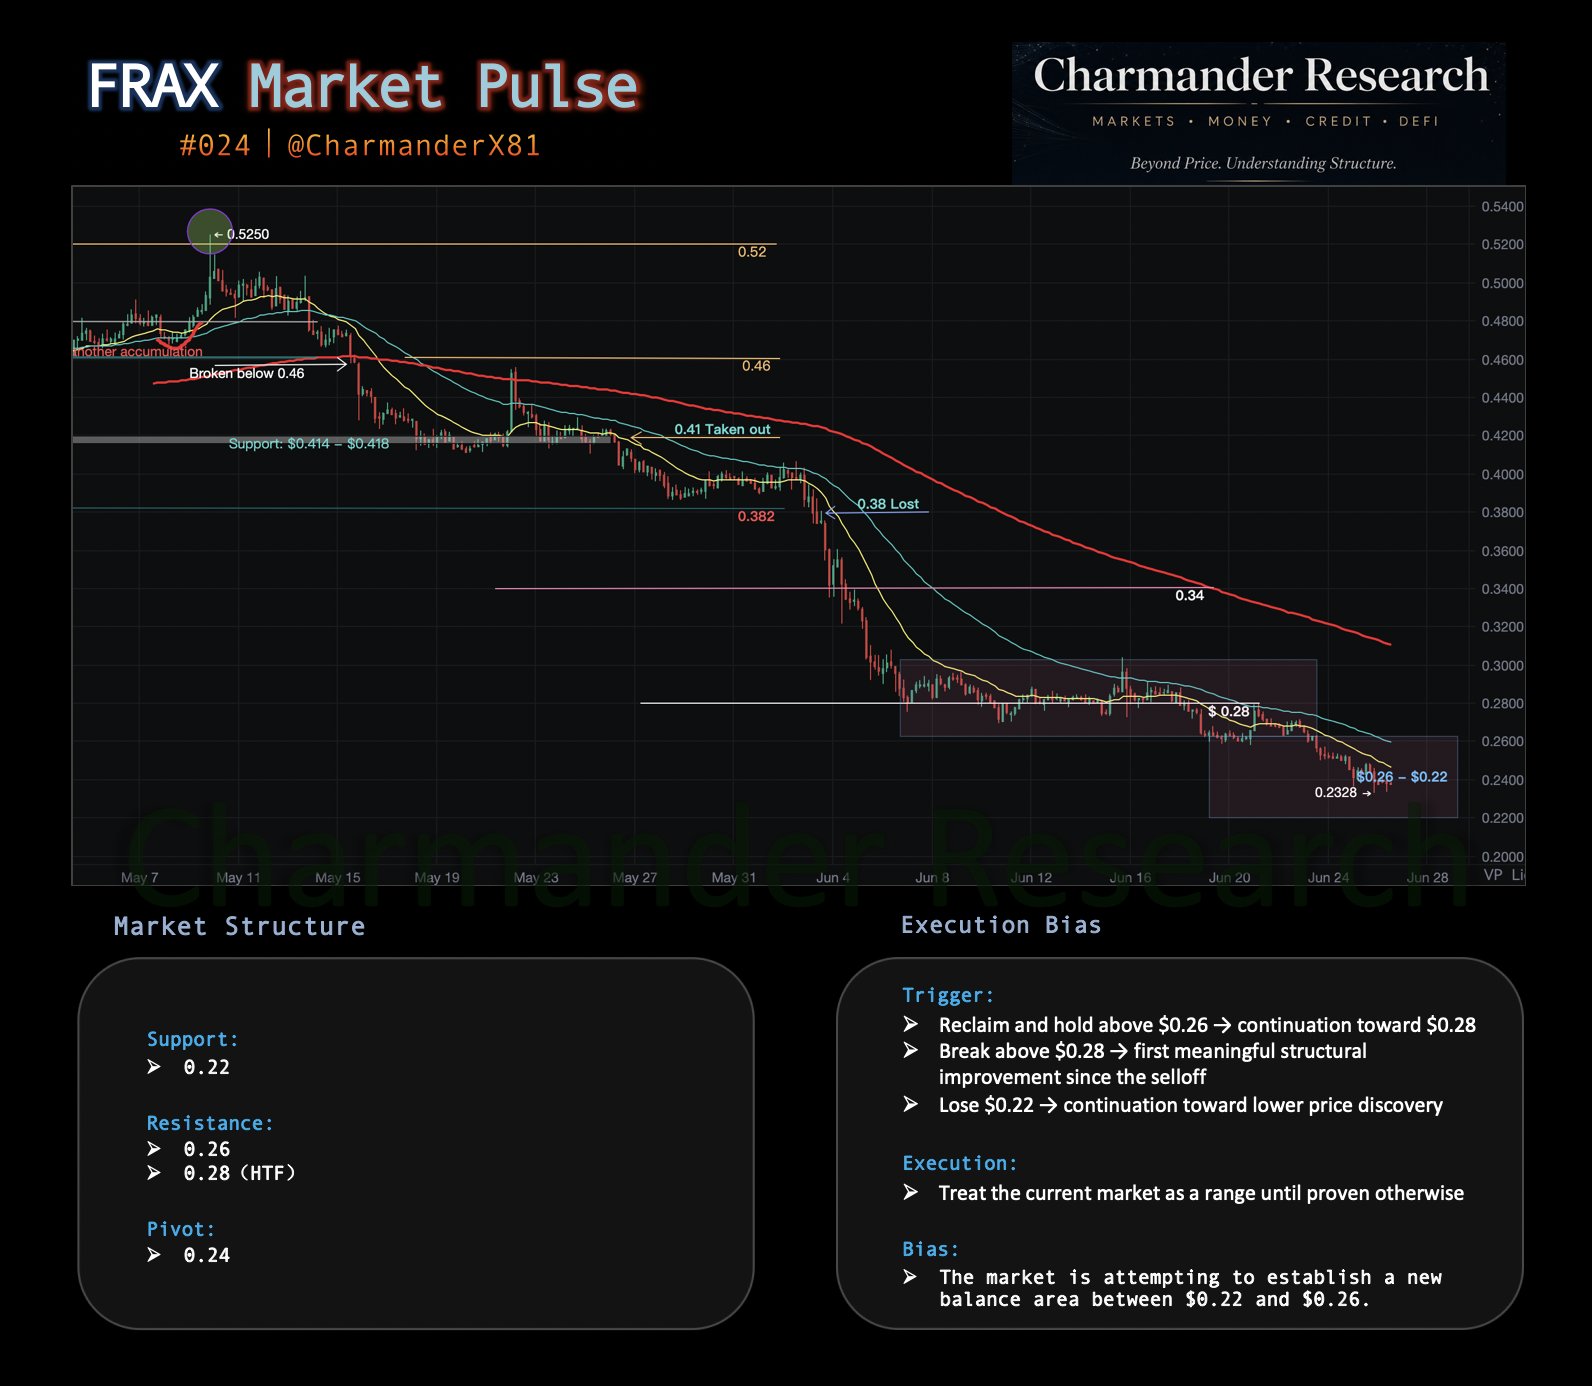
141 @CharmanderX81 [ $FRAX Market Pulse 🔥 #24 ]
🔔 Market
Over the past week, price has continued consolidating inside the $0.22–$0.26 trading range that we identified in the previous Market Pulse.
Rather than accelerating lower, the market is beginning to accept this new range as its short-term balance area.
After breaking below the previous $0.26–$0.30 box, price is no longer searching for the next support.
It is now searching for a new equilibrium.
So far, buyers have continued defending the lower portion of the range, while rallies remain capped below $0.26.
The market is building energy. The next directional move will likely come from a breakout of this balance area.
Current Structure
Support: $0.22
Resistance: $0.26 & $0.28 (HTF)
Pivot: $0.24
Trigger
• Reclaim and hold above $0.26 → continuation toward $0.28
• Break above $0.28 → first meaningful structural improvement since the selloff
• Lose $0.22 → continuation toward lower price discovery
Execution
• Treat the current market as a range until proven otherwise
 8
8
 0
0
 162
162
2026-06-26 06:27
リリース後のFRAXのトレンド
中立
FRAX is consolidating in the $0.22-$0.26 range, awaiting a breakout to determine the next direction.
captnhayz ¤
DeFi_Expert
Community_Lead
B
3.3K @captnhayz 中立
FRAX may launch a new product, but there is no clear signal in the short term

Sean Kelley D
3.4K @SeanKelleyX @0xNairolf imagine it being offered by @Frax 🔜
21
5
352
2026-06-24 15:27
リリース後のFRAXのトレンド
中立
FRAX may launch a new product, but there is no clear signal in the short term
captnhayz ¤
DeFi_Expert
Community_Lead
B
3.3K @captnhayz 強気
Frax is seen as a robust peg keeper, worth watching.

Alto D
35.3K @alto_money Frax: The Patrician Choice for Pegkeeping https://t.co/4E8urms5V2
20
0
3.0K
2026-06-24 12:57
リリース後のFRAXのトレンド
強気
Frax is seen as a robust peg keeper, worth watching.
価格予測
FRAXを購入するのに良い時期はいつですか?FRAXは今買いでしょうか、売りでしょうか?
Frax (prev. FXS)(FRAX)を購入または売却する適切な時期を決定する際は、まずご自身の取引戦略とリスクプロファイルに合わせることが重要です。長期投資家と短期トレーダーは市場状況を異なる方法で解釈することが多いため、決定には個人的なアプローチを反映すべきです。 最新の FRAX 4時間テクニカル分析によると、現在の取引シグナルは ホールド です。 最新のFRAX1日テクニカル分析によると、現在のシグナルはホールドです。

ビーコン予測
の確率的価格予測(今後24時間)ビーコン予測に関する免責事項
このページに表示されるデータ結果は、選択した取引ペアの実際の取引データ(OHLCV)と対応するテクニカル指標に基づいて分析されています。
この予測は実験的な技術的成果であり、あくまで参考目的で提供しています。これは投資アドバイスをではありません。現実世界での予期せぬ出来事が市場行動に大きな影響を与える可能性があります。トレーダーは慎重に意思決定を行うべきです。
この予測は実験的な技術的成果であり、あくまで参考目的で提供しています。これは投資アドバイスをではありません。現実世界での予期せぬ出来事が市場行動に大きな影響を与える可能性があります。トレーダーは慎重に意思決定を行うべきです。
アプリバージョン Frax (prev. FXS)
Frax (prev. FXS) (FRAX) is a cryptocurrency launched in 2020and operates on the Ethereum platform. Frax (prev. FXS) has a current supply of 99,681,495.59113361 with 93,597,685.70121376 in circulation. The last known price of Frax (prev. FXS) is 0.26855063 USD and is down -1.81 over the last 24 hours. It is currently trading on 338 active market(s) with $432,050.48 traded over the last 24 hours. More information can be found at https://frax.com.
続きを読む
Chain explorer
さらに詳しく
BM Discovery


新規上場

SOXLON Direxion Daily Semi Bull 3X ETF
-- 0.00%

NIOON NIO
-- 0.00%

HYGON iBoxx $ High Yield Corporate Bond ETF
-- 0.00%

AURON Aurora Innovation
-- 0.00%

IGVON iShares Expanded Tech-Software ETF
-- 0.00%

SQQQON ProShares UltraPro Short QQQ
-- 0.00%

IBITON iShares Bitcoin Trust ETF
-- 0.00%

AMCON AMC Entertainment Holdings
-- 0.00%

GRABON Grab Holdings
-- 0.00%

SNAPON Snap(Ondo)
-- 0.00%