Rewards
Futures Daily Draw
100% Chance To Win With Daily Trades
現物の日次のドロー
Win 8,888 USDT In Grand Prizes
ステークして投票
投票してエアドロップを獲得
機関
プロなかつ専門的なサービス対応
BitMart VIP
限定報酬のロック解除
アカデミー
トレードとブロックチェーンについて
BitMart Internship
Start your Crypto Career Here
BitMart Travel
ワンストップグローバルトラベルサービス
モバイルチャージ
モバイルを簡単に、オンラインで、安全にチャージ
Send
Send money globally, fast and secure
BitMartモール
Live on crypto

Infinex ライブ価格データ
Infinexの今日の価格は$ 0.0086 (INX/USD)です。 時価総額$ 17.20M USD、 24時間取引量$ 632.01K USD、 24時間の価格変動+6.80%、 そして流通供給量1.99B INX。
Infinex INX 価格履歴 USD
Infinexの今日、7日間、30日間、90日間の価格を追跡
期間
24H変動幅
24H変動率 (%)
本日
$ 0.00056
7.05%
7日
$ 0.00048
6.00%
30日
$ 0.00018
-2.15%
90日
$ 0.0024
-22.40%
INXを今すぐ所有
BitMartでINXを簡単に安全に売買できます。
Infinex 相場情報
$ 0.0080 24H変動幅 $ 0.0087
過去最高値
$ 0.052
過去最安値
$ 0.0062
24H変動幅
6.80%
24H取引高
$ 632,013.84
供給量
1.99B
INX
時価総額
$ 17.20M
最大供給量
10.00B
INX
完全希薄化後時価総額
$ 86.26M
取引 INX

Infinex Xインサイト

Crypto Tolga
TA_Analyst
Trader
B
 79.1K @CryptoTolga_
 非常に強気
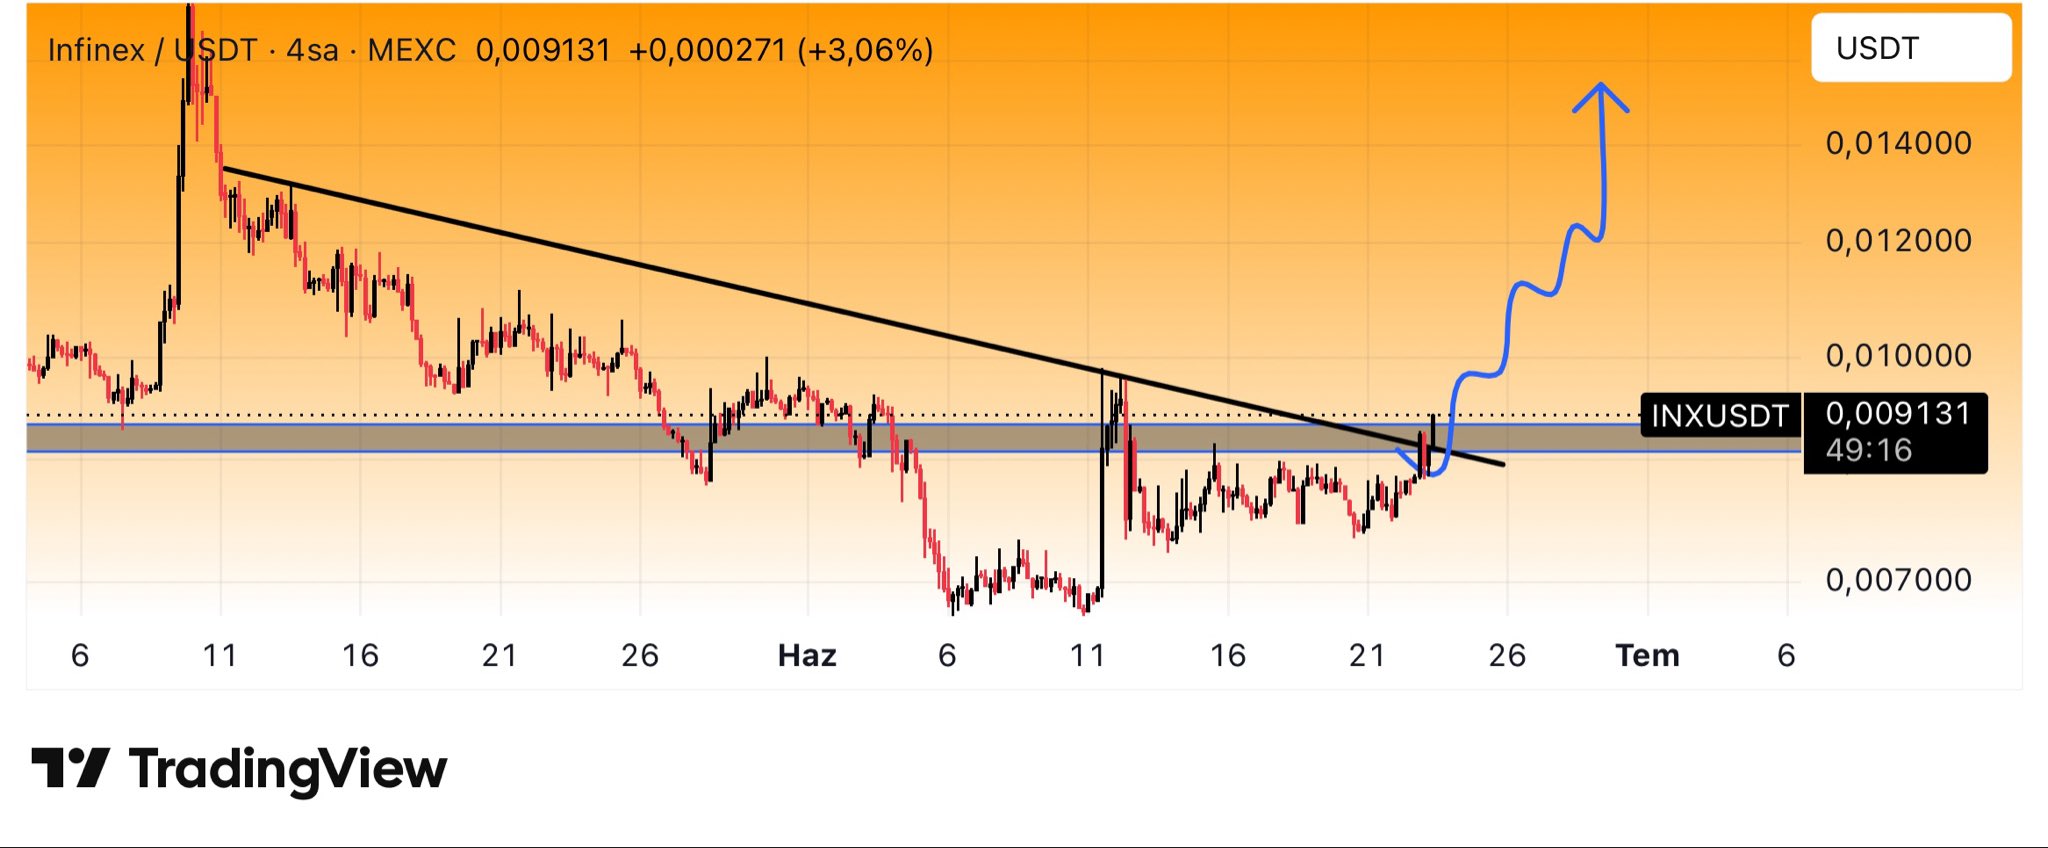
INX has broken the descending trendline and is likely to continue breaking the horizontal resistance level, showing strong upward potential.
Crypto Tolga
TA_Analyst
Trader
B
79.1K @CryptoTolga_ #INXUSDT $INX #Binance Alpha
The descending trendline breakout has occurred, and a horizontal resistance breakout appears to be next.
Lately, many coins have made strong moves once they broke their horizontal resistance zones.
This chart is shaping up well and is definitely worth keeping on the watchlist.
 96
96
 25
25
 8.2K
8.2K
2026-06-23 11:42
リリース後のINXのトレンド
非常に強気
INX has broken the descending trendline and is likely to continue breaking the horizontal resistance level, showing strong upward potential.
Crypto Tolga
TA_Analyst
Trader
B
79.1K @CryptoTolga_ 非常に強気
INX has broken the descending trendline and is likely to continue breaking the horizontal resistance level, showing strong upward potential.
#INXUSDT $INX #Binance Alpha
The descending trendline breakout has occurred, and a horizontal resistance breakout appears to be next.
Lately, many coins have made strong moves once they broke their horizontal resistance zones.
This chart is shaping up well and is definitely worth keeping on the watchlist.
96
25
8.2K
2026-06-23 11:12
リリース後のINXのトレンド
非常に強気
INX has broken the descending trendline and is likely to continue breaking the horizontal resistance level, showing strong upward potential.

ERROR
TA_Analyst
Trader
A
11.2K @ER404i 弱気
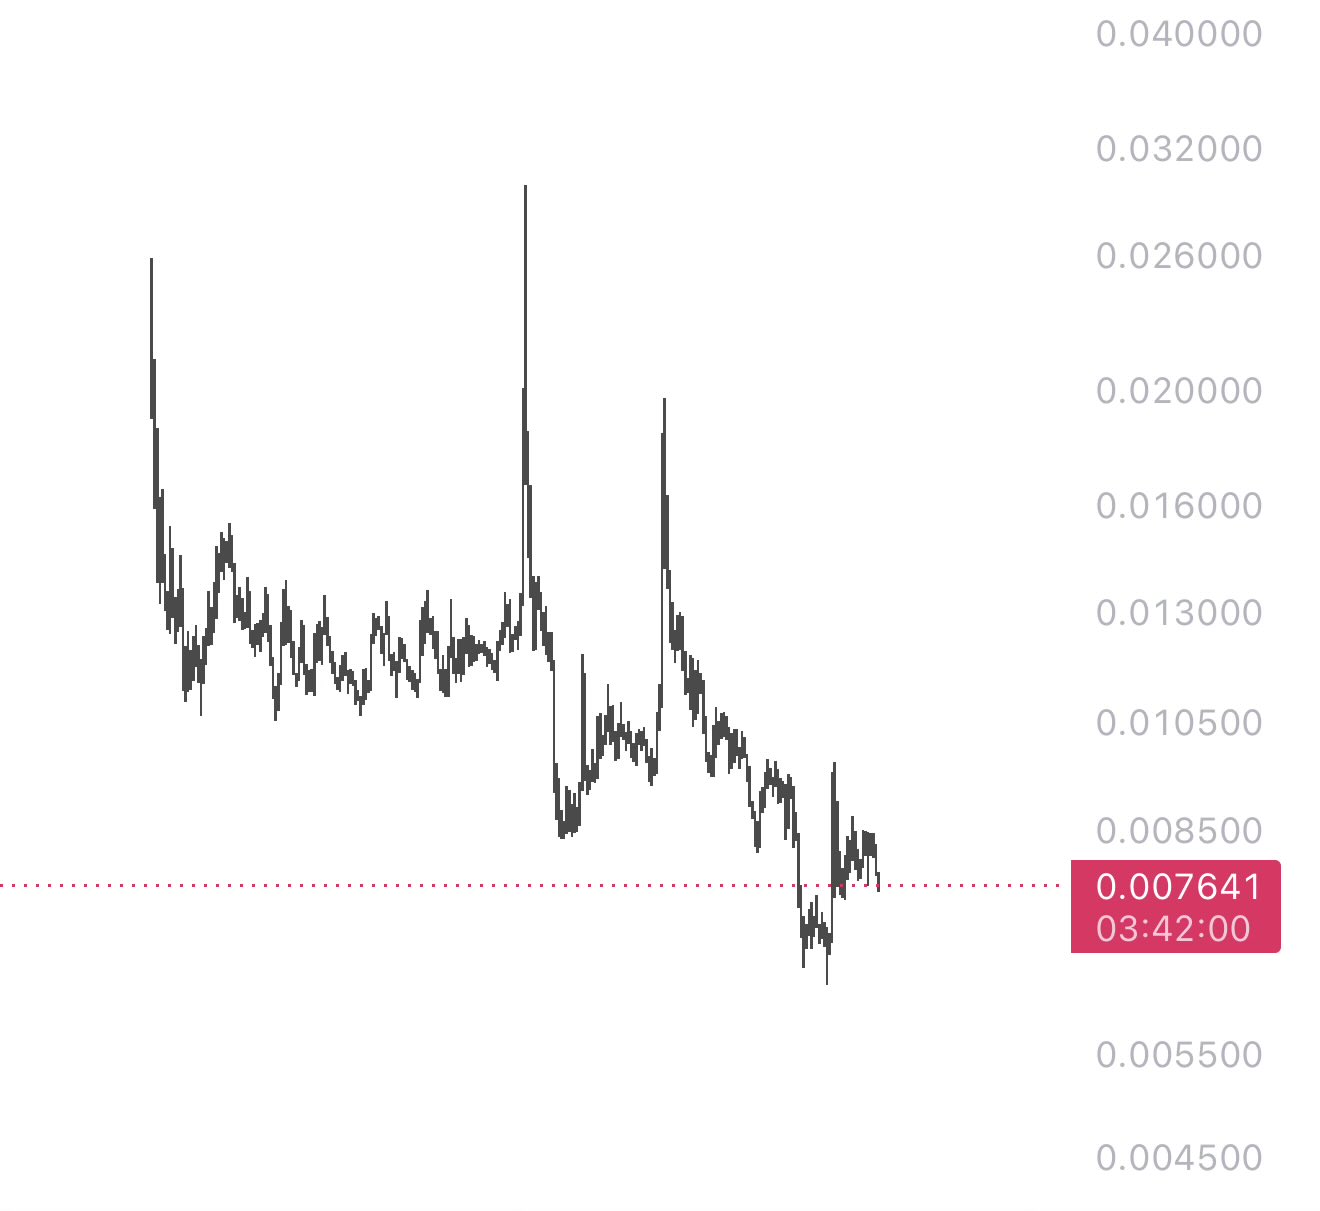
INX price is dead, the chart shows continued weakness.
Some CT shilled this shit $INX but chart already dead. https://t.co/dVqmBxazNo
 19
4
2.4K
19
4
2.4K
2026-06-20 20:27
リリース後のINXのトレンド
非常に弱気
INX price is dead, the chart shows continued weakness.
価格予測
INXを購入するのに良い時期はいつですか?INXは今買いでしょうか、売りでしょうか?
Infinex(INX)を購入または売却する適切な時期を決定する際は、まずご自身の取引戦略とリスクプロファイルに合わせることが重要です。長期投資家と短期トレーダーは市場状況を異なる方法で解釈することが多いため、決定には個人的なアプローチを反映すべきです。 最新の INX 4時間テクニカル分析によると、現在の取引シグナルは ホールド です。 最新のINX1日テクニカル分析によると、現在のシグナルは売却です。

ビーコン予測
の確率的価格予測(今後24時間)ビーコン予測に関する免責事項
このページに表示されるデータ結果は、選択した取引ペアの実際の取引データ(OHLCV)と対応するテクニカル指標に基づいて分析されています。
この予測は実験的な技術的成果であり、あくまで参考目的で提供しています。これは投資アドバイスをではありません。現実世界での予期せぬ出来事が市場行動に大きな影響を与える可能性があります。トレーダーは慎重に意思決定を行うべきです。
この予測は実験的な技術的成果であり、あくまで参考目的で提供しています。これは投資アドバイスをではありません。現実世界での予期せぬ出来事が市場行動に大きな影響を与える可能性があります。トレーダーは慎重に意思決定を行うべきです。
アプリバージョン Infinex
Infinex (INX) is a cryptocurrency launched in 2026and operates on the Ethereum platform. Infinex has a current supply of 10,000,000,000 with 1,994,300,000 in circulation. The last known price of Infinex is 0.00798997 USD and is down -0.02 over the last 24 hours. It is currently trading on 86 active market(s) with $3,908,697.75 traded over the last 24 hours. More information can be found at https://infinex.xyz/.
続きを読む
さらに詳しく
BM Discovery


新規上場

SOXLON Direxion Daily Semi Bull 3X ETF
-- 0.00%

NIOON NIO
-- 0.00%

HYGON iBoxx $ High Yield Corporate Bond ETF
-- 0.00%

AURON Aurora Innovation
-- 0.00%

IGVON iShares Expanded Tech-Software ETF
-- 0.00%

SQQQON ProShares UltraPro Short QQQ
-- 0.00%

IBITON iShares Bitcoin Trust ETF
-- 0.00%

AMCON AMC Entertainment Holdings
-- 0.00%

GRABON Grab Holdings
-- 0.00%

SNAPON Snap(Ondo)
-- 0.00%
購入 INX
取引 INX