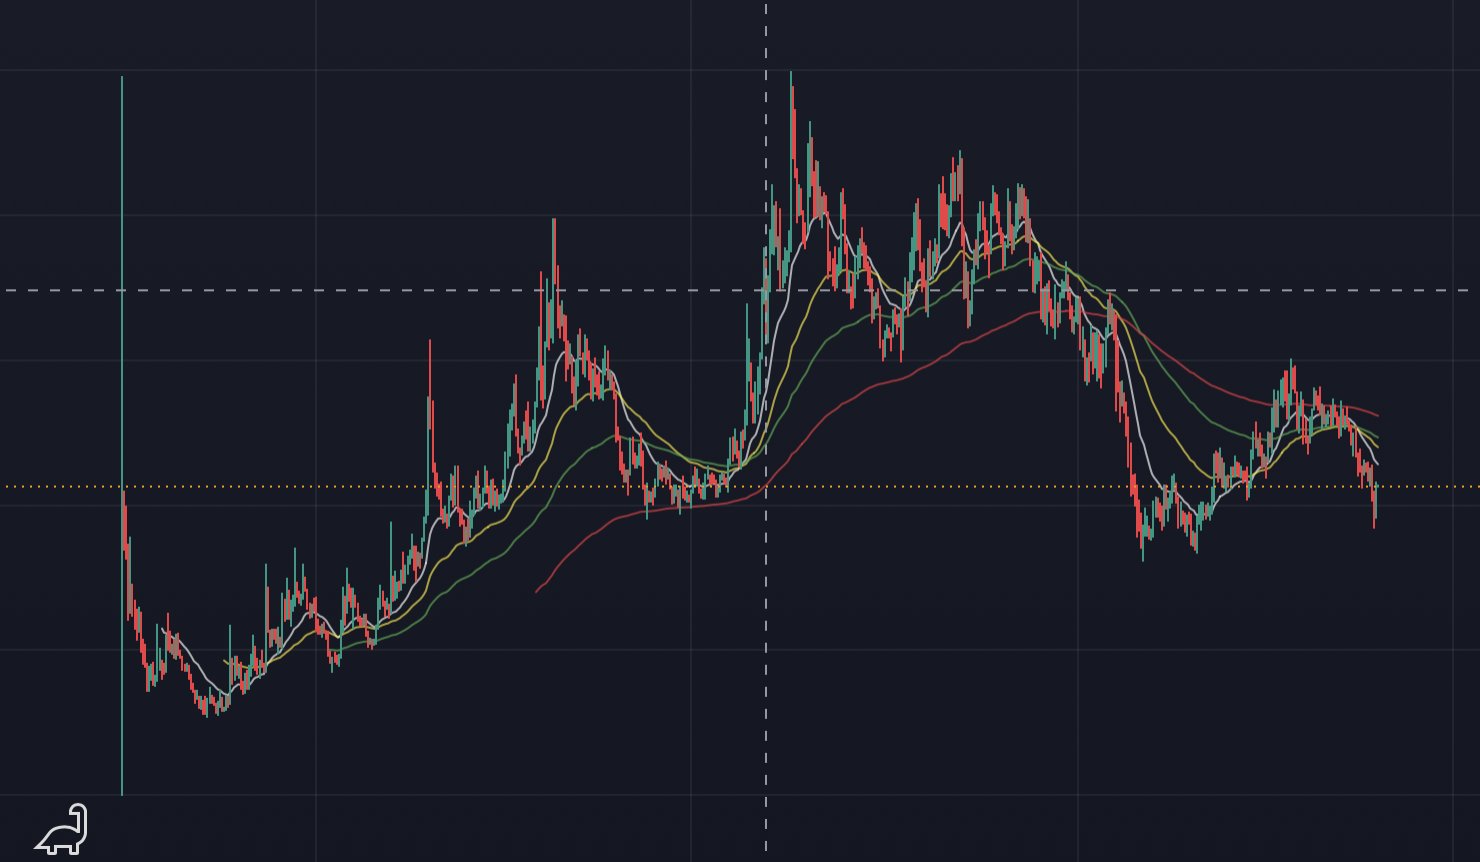
$ZAMA chart reminds me of the $CFG chart. https://t.co/76IAiLkpYS


 3.2K @KubrickShining
 $ZAMA chart reminds me of the $CFG chart. https://t.co/76IAiLkpYS
 0
0
 0
0
 149
3.2K @KubrickShining
149
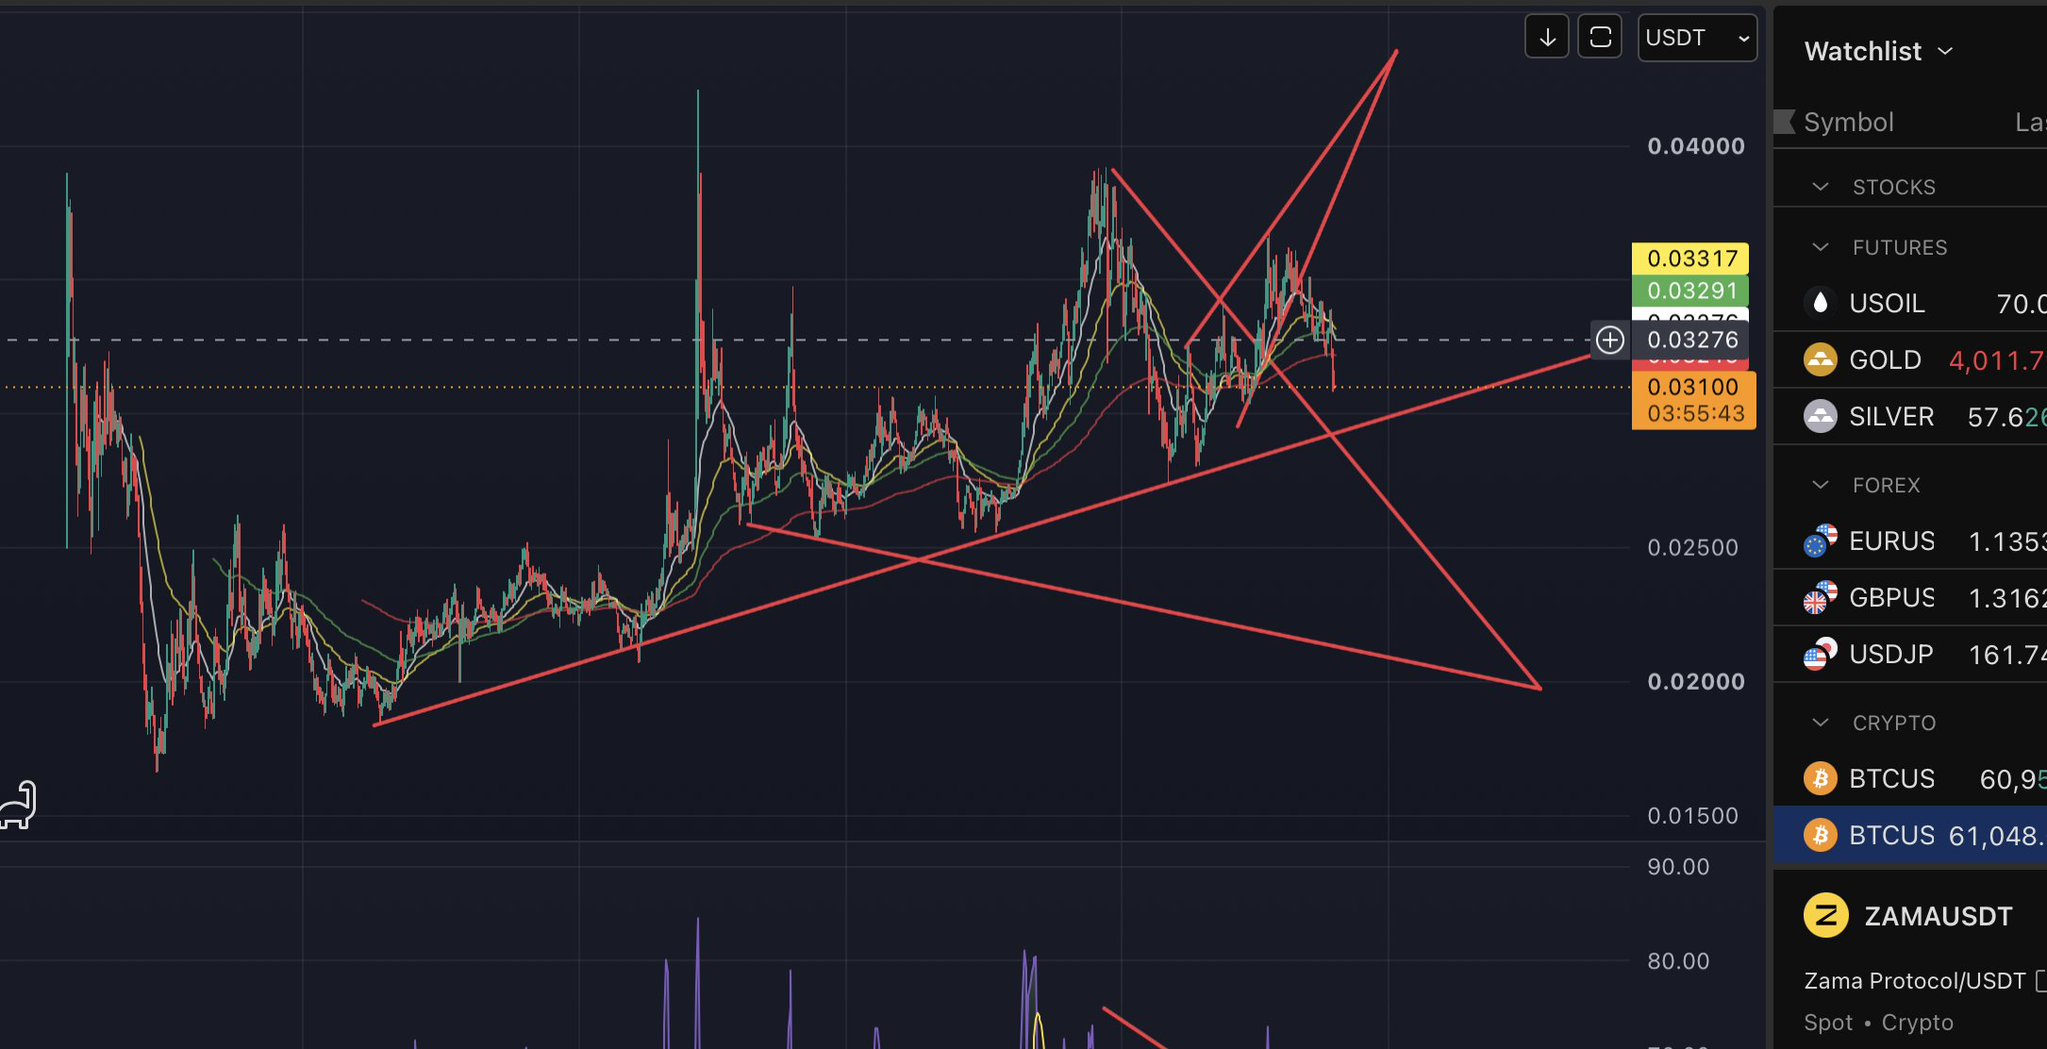
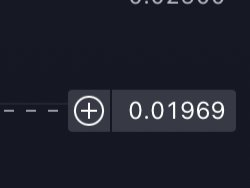
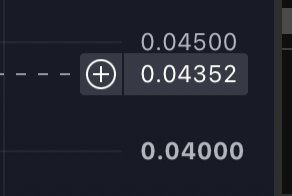
3.2K @KubrickShining $ZAMA update: Slightly bullish, but I would be more bullish if I didn't have this lower target, and a RSI falling wedge on the chart. I do see two things that make me think it can still continue upward. Upper target is 0.043 and lower is 0.019. Lower target is pretty clean on the weekly. Big sell signal on the daily. Bullish divergence on the 2hr, and on the 30.
There is an unlock on July 2nd. little over 1M coins will dropped into circulation. Curious if this is another $Based stye listing where you have to wait to get a return or buy in lower. I'm already in, I thought the concept will do good in the next bull. I will buy in again at my lower target. Not buying again though, unless it hits entry.
 0
0
452
0
0
452
 262.2K @AltcoinSherpa
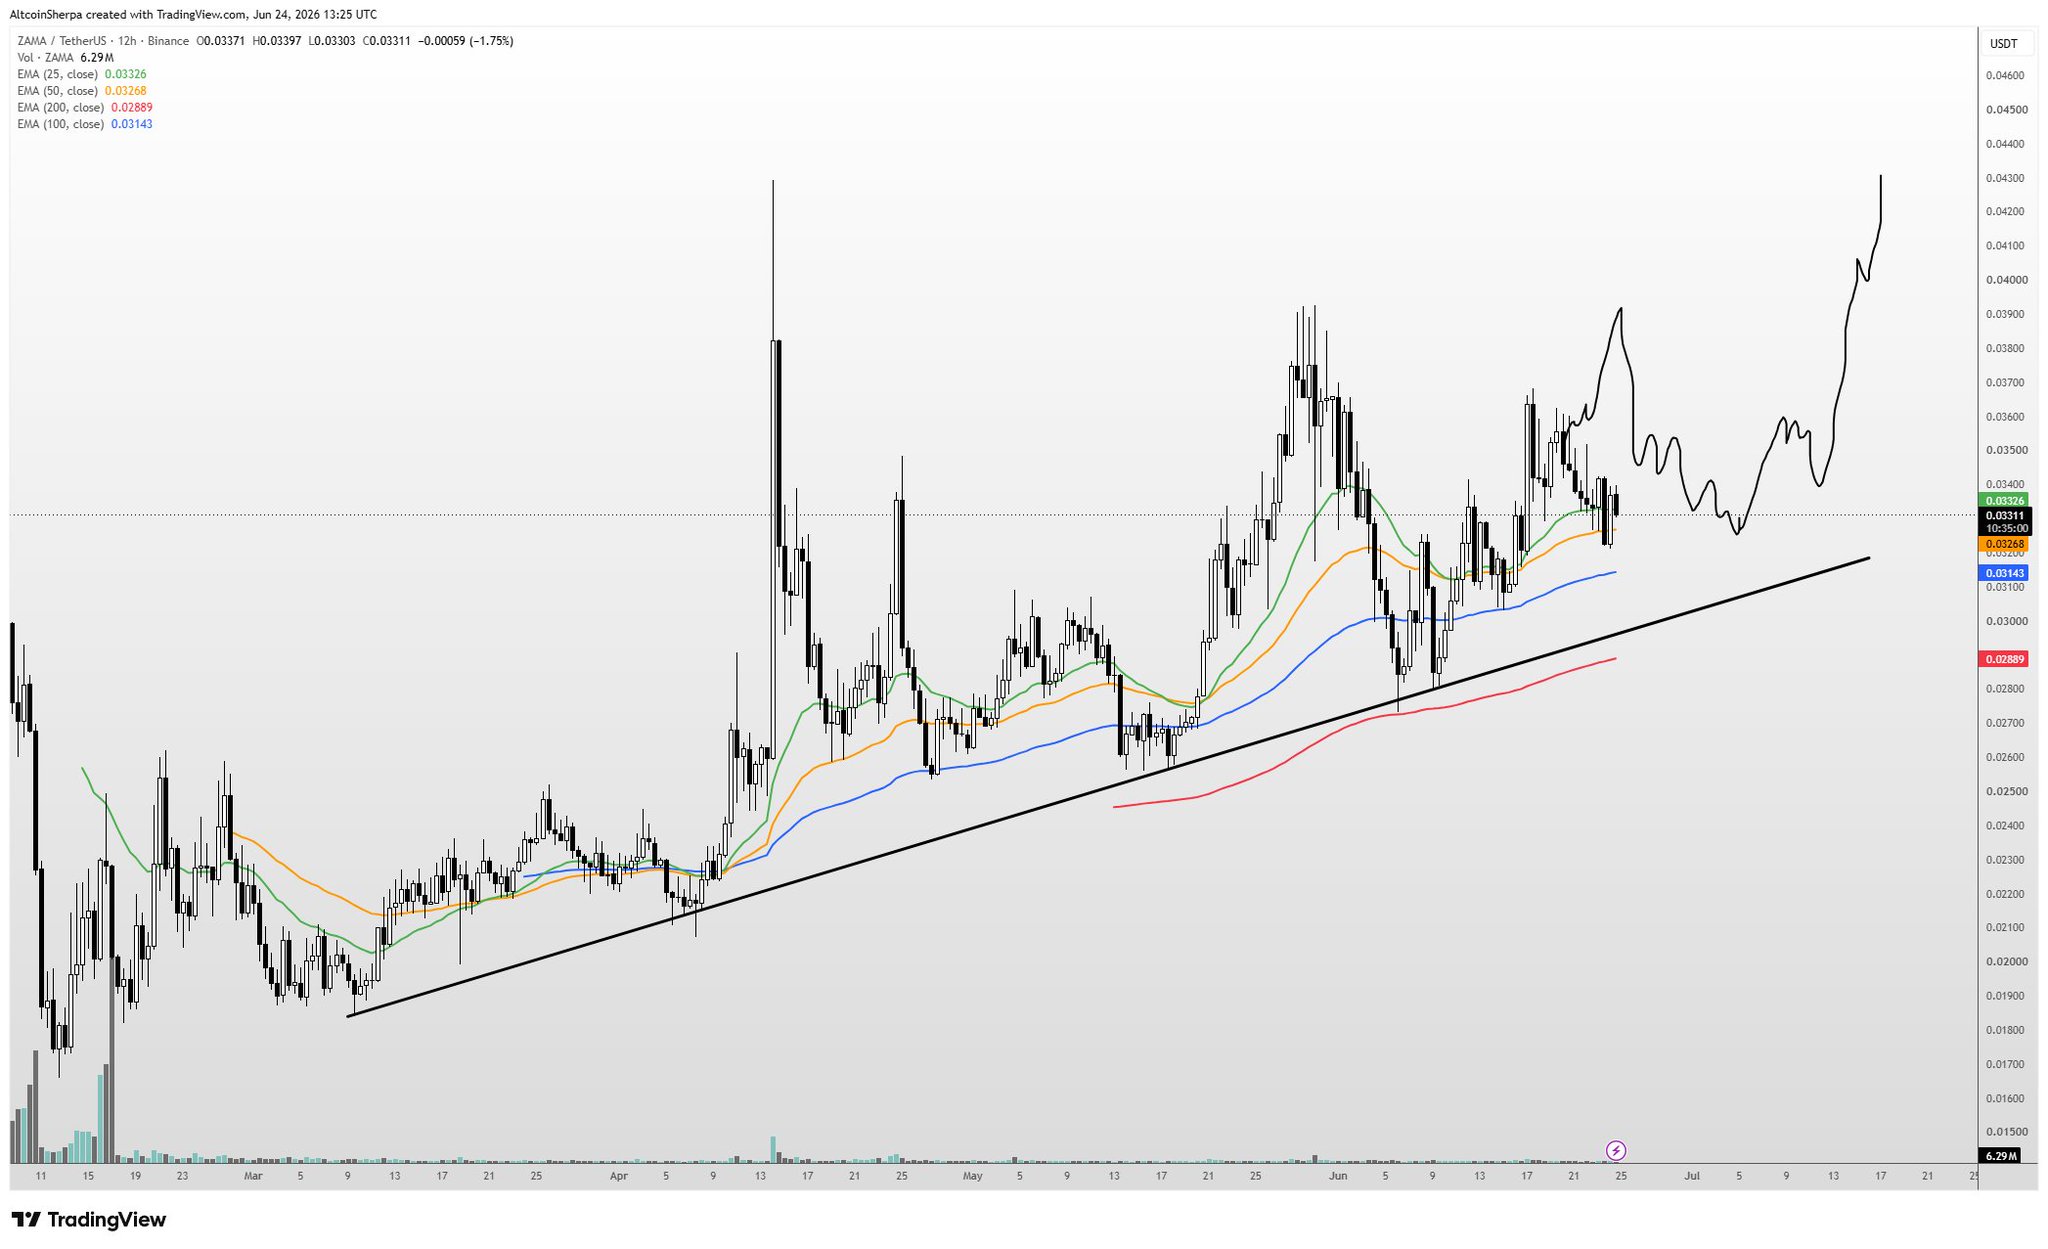
 $ZAMA it looks like their confidential vault is live and ZAMA is the intersection between privacy + DeFi. Price has held up pretty well on a relative basis and I still expect it to respect the trendline. Strong coin lately https://t.co/dj1VZkFjIc
 2 @AC626_
 @AltcoinSherpa $ZAMA please
9
2
9.9K