Rewards
Futures Daily Draw
100% Chance To Win With Daily Trades
현물 일일 추첨
Win 8,888 USDT In Grand Prizes
휴대폰 요금 충전
온라인으로 간편하고 안전하게 휴대폰 요금을 충전하세요.
Send
Send money globally, fast and secure
BitMart Mall
Live on crypto

Frax (prev. FXS) (FRAX)
$ 0.23 (FRAX/USD)
0.00%
24H
Frax (prev. FXS) Live Price data
Today's price of Frax (prev. FXS) Is $ 0.23 (FRAX/USD). With A Market Cap Of $ 22.43M USD. 24-Hour Trading Volume Of $ 405.03K USD, A 24-Hour Price Change Of +0.00%, And A Circulating Supply Of 93.60M FRAX.
Frax (prev. FXS) FRAX Price History USD
Track the price of Frax (prev. FXS) for today, 7 days, 30 days and 90 days
기간
변경하기
Change (%)
오늘
$ 0
0.00%
7일
$ 0.019
-7.69%
30일
$ 0.15
-40.00%
90일
$ 0.16
-41.46%
Own FRAX Now
Buy and sell FRAX easily and securely on BitMart.
Frax (prev. FXS) Market Information
$ 0.22 24h Range $ 0.23
All time high
$ 1.47
All time low
$ 0.22
24시간 변동률
0.00%
24시간 거래량
$ 405,031.09
유통량
93.59M
FRAX
Market cap
$ 22.43M
Max supply
99.68M
FRAX
Fully diluted market cap
$ 23.89M
거래하기 FRAX

Frax (prev. FXS) X 인사이트

captnhayz ¤
DeFi 전문가
커뮤니티 리더
B
 3.3K @captnhayz
 중립
FRAX가 $0.22-$0.26 구역에서 횡보 중이며, 다음 방향을 정하기 위한 브레이크아웃을 기다리고 있습니다.

Charmander D
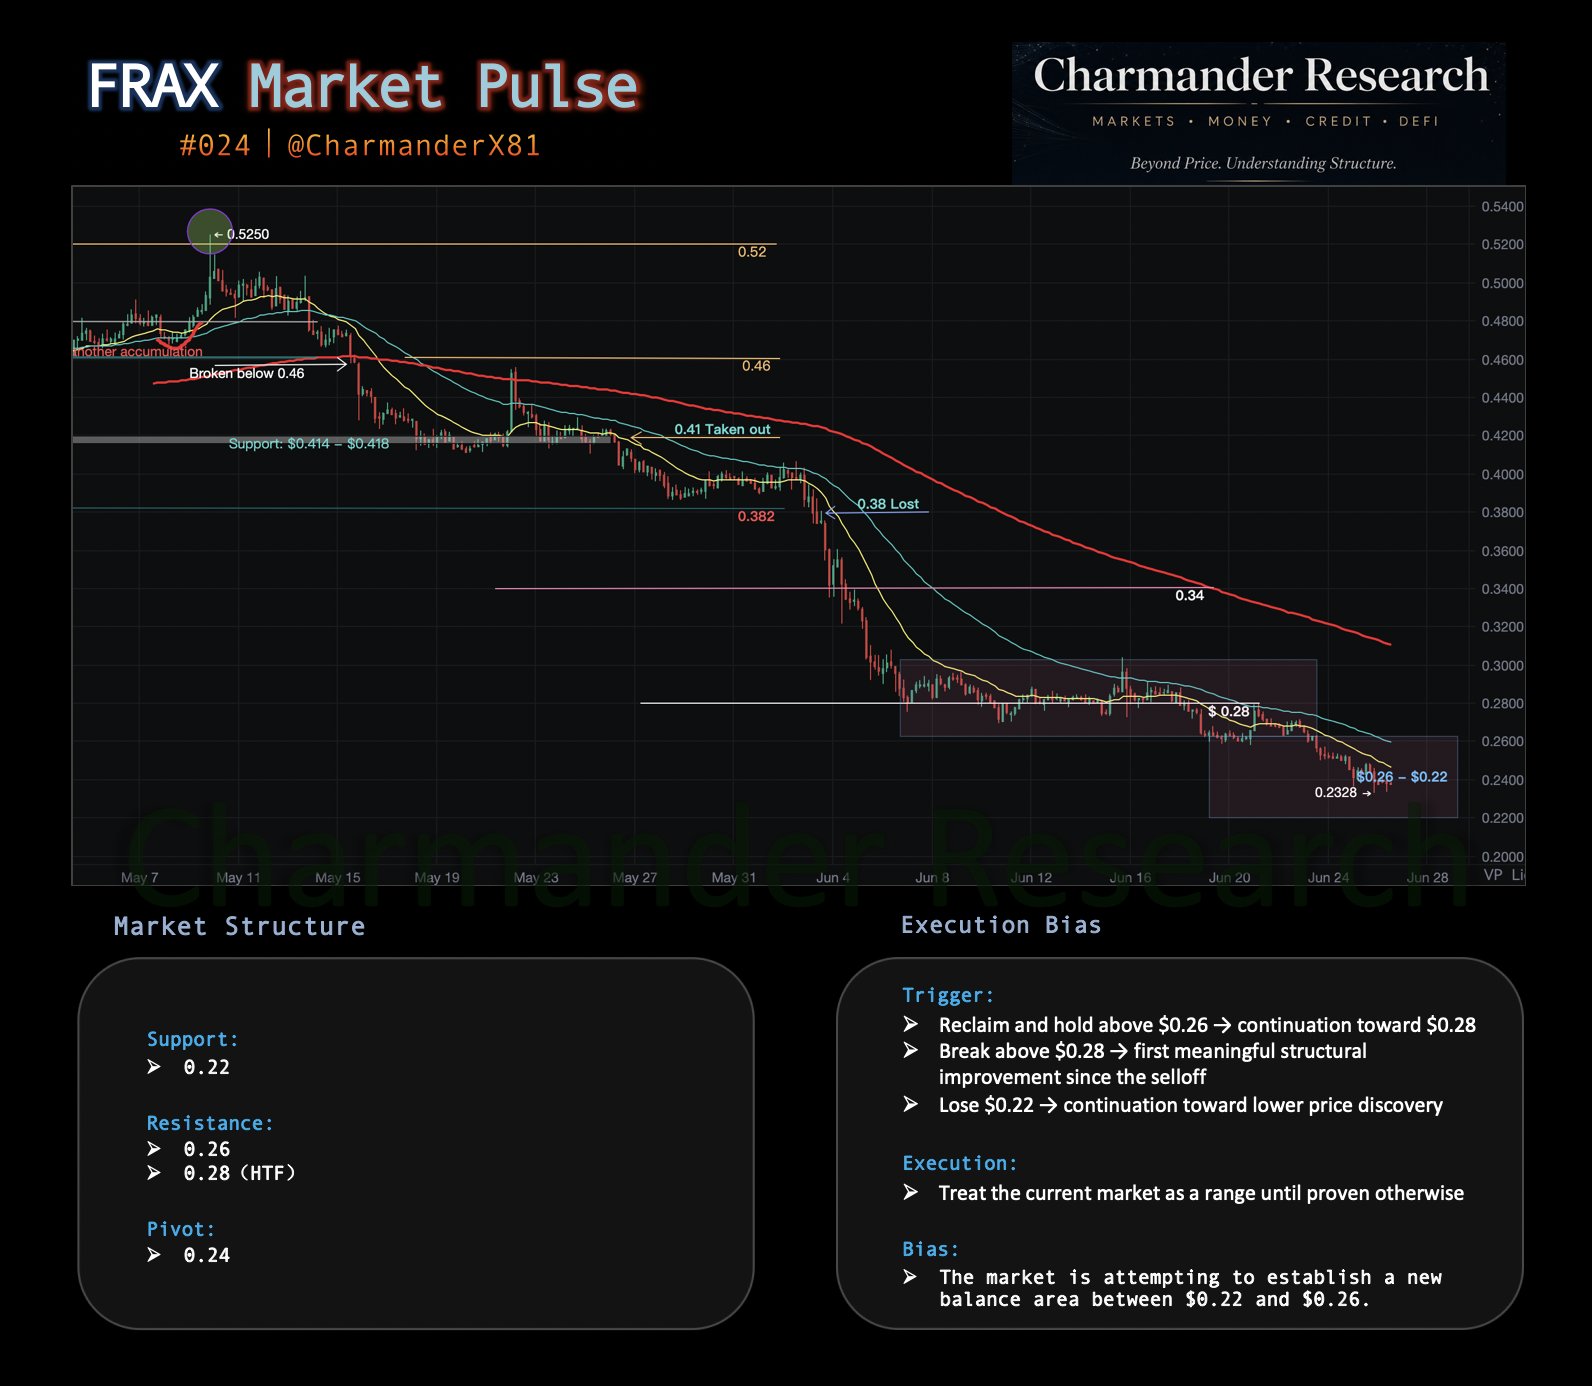
140 @CharmanderX81 [ $FRAX Market Pulse 🔥 #24 ]
🔔 시장
지난 일주일 동안 가격은 이전 Market Pulse에서 식별한 $0.22–$0.26 거래 구역 내에서 계속 횡보했습니다.
하락 가속 대신, 시장은 이 새로운 구역을 단기 균형 영역으로 받아들이기 시작했습니다.
이전 $0.26–$0.30 박스 아래로 내려간 후, 가격은 더 이상 다음 지지를 찾지 않습니다.
이제 새로운 균형을 찾고 있습니다.
지금까지 매수자는 구역 하단을 방어해 왔으며, 상승은 $0.26 이하에서 제한됩니다.
시장은 에너지를 축적하고 있습니다. 다음 방향 움직임은 이 균형 구역의 돌파에서 나올 가능성이 높습니다.
현재 구조
지지: $0.22
저항: $0.26 & $0.28 (고시간 프레임)
피벗: $0.24
트리거
• $0.26 위로 재점령 및 유지 → $0.28 방향 지속
• $0.28 위로 돌파 → 매도 이후 최초 의미 있는 구조 개선
• $0.22 하락 → 더 낮은 가격 탐색 지속
실행
• 별다른 증거가 나오기 전까지 현재 시장을 구간으로 간주
 8
8
 0
0
 157
157
2026-06-26 06:27
FRAX의 출시 후 추세
중립
FRAX가 $0.22-$0.26 구역에서 횡보 중이며, 다음 방향을 정하기 위한 브레이크아웃을 기다리고 있습니다.
captnhayz ¤
DeFi 전문가
커뮤니티 리더
B
3.3K @captnhayz 중립
FRAX가 새로운 제품을 출시할 수 있지만, 단기적으로는 명확한 신호가 없습니다.

Sean Kelley D
3.4K @SeanKelleyX @0xNairolf @Frax가 제공하는 것을 상상해 보세요 🔜
21
5
352
2026-06-24 15:27
FRAX의 출시 후 추세
중립
FRAX가 새로운 제품을 출시할 수 있지만, 단기적으로는 명확한 신호가 없습니다.
captnhayz ¤
DeFi 전문가
커뮤니티 리더
B
3.3K @captnhayz 상승세
Frax는 견고한 페그 유지자로 간주되며, 주목할 만합니다.

Alto D
35.2K @alto_money Frax: 페그 유지의 귀족 선택 https://t.co/4E8urms5V2
20
0
3.0K
2026-06-24 12:57
FRAX의 출시 후 추세
상승세
Frax는 견고한 페그 유지자로 간주되며, 주목할 만합니다.
가격 예측
When is a good time to buy FRAX? Should I buy or sell FRAX now?
When deciding whether it’s a good time to buy or sell Frax (prev. FXS) (FRAX), it’s important to first align with your own trading strategy and risk profile.Long-term investors and short-term traders often interpret market conditions differently, so your decision should reflect your personal approach. According to the latest FRAX 4-hour technical analysis, the current trading signal is Hold. According to the latest FRAX 1-day technical analysis, the current signal is Hold.

Beacon Prediction
Probabilistic Price Forecast (Next 24 Hours)Beacon Prediction Disclaimer
The data results displayed on this page are analyzed based on actual trading data (OHLCV) of the selected trading pair along with corresponding technical indicators.
This prediction is an experimental technical product and is provided for reference purposes only. It does not constitute investment advice. Unexpected real-world events may significantly impact market behavior. Traders should make decisions with caution.
This prediction is an experimental technical product and is provided for reference purposes only. It does not constitute investment advice. Unexpected real-world events may significantly impact market behavior. Traders should make decisions with caution.
소개 Frax (prev. FXS)
Frax (prev. FXS) (FRAX) is a cryptocurrency launched in 2020and operates on the Ethereum platform. Frax (prev. FXS) has a current supply of 99,681,495.59113361 with 93,597,685.70121376 in circulation. The last known price of Frax (prev. FXS) is 0.26855063 USD and is down -1.81 over the last 24 hours. It is currently trading on 338 active market(s) with $432,050.48 traded over the last 24 hours. More information can be found at https://frax.com.
자세히 읽어보기
Chain Explorer
Explore More
BM 디스커버리


새 리스팅

SOXLON Direxion Daily Semi Bull 3X ETF
-- 0.00%

NIOON NIO
-- 0.00%

HYGON iBoxx $ High Yield Corporate Bond ETF
-- 0.00%

AURON Aurora Innovation
-- 0.00%

IGVON iShares Expanded Tech-Software ETF
-- 0.00%

SQQQON ProShares UltraPro Short QQQ
-- 0.00%

IBITON iShares Bitcoin Trust ETF
-- 0.00%

AMCON AMC Entertainment Holdings
-- 0.00%

GRABON Grab Holdings
-- 0.00%

SNAPON Snap(Ondo)
-- 0.00%