Rewards
Futures Daily Draw
100% Chance To Win With Daily Trades
현물 일일 추첨
Win 8,888 USDT In Grand Prizes
휴대폰 요금 충전
온라인으로 간편하고 안전하게 휴대폰 요금을 충전하세요.
Send
Send money globally, fast and secure
BitMart Mall
Live on crypto

Nebius Group NV (Derivatives) (NBIS)
$ 261.89 (NBIS/USD)
7.51%
24H
Nebius Group NV (Derivatives) NBIS Price History USD
Track the price of Nebius Group NV (Derivatives) for today, 7 days, 30 days and 90 days
기간
변경하기
Change (%)
오늘
$ 18.29
7.51%
7일
$ 38.22
-13.40%
30일
$ 11.61
4.93%
90일
$ 11.61
4.93%
Own NBIS Now
Buy and sell NBIS easily and securely on BitMart.
Nebius Group NV (Derivatives) Market Information
$ 235.90 24h Range $ 260.65
All time high
$ 297.52
All time low
$ 201.05
24시간 변동률
7.51%
24시간 거래량
$ 0
유통량
0.00
NBIS
Market cap
$ 0
Max supply
--
Fully diluted market cap
$ 0
거래하기 NBIS

Nebius Group NV (Derivatives) X 인사이트

Yimin X
퀀트 트레이더
펀더멘털 분석가
B
 14.5K @yxinsights
 상승세
NBIS는 $252.56에서 지지를 받아 단기 반등 추세를 보이고 있습니다.

Ace D
5.4K @acethebulllly $NBIS가 건설적인 당일 회복을 계속 이어가며, 매수자는 풀백을 흡수하고 높은 가격을 꾸준히 되찾는 동시에 $260.01의 5.56K 매도벽 아래에서 상단 유동성이 즉각적인 상승 여력을 제한합니다. 가격은 $252.56에서 거래되고, 매수 호가가 매도 압력을 지속 흡수하며, 더 큰 유동성 클러스터 위에 머무르는 것이 단기 모멘텀을 매수자에게 유리하게 유지하고, 상단 공급을 돌파하면 추가 확장의 경로가 열립니다.
저항:
• $257.99 — 3.68K 매도
• $260.01 — 5.56K 매도
• $262.01 — 3.12K 매도
지지:
• $252.56 — 15.91K 매수
• $246.99 — 6.32K 매수
• $243.01 — 4.65K 매수
 7
7
 17
17
 1.0K
1.0K
2026-06-29 16:37
NBIS의 출시 후 추세
상승세
NBIS는 $252.56에서 지지를 받아 단기 반등 추세를 보이고 있습니다.

chad.
기술 분석가
트레이더
B
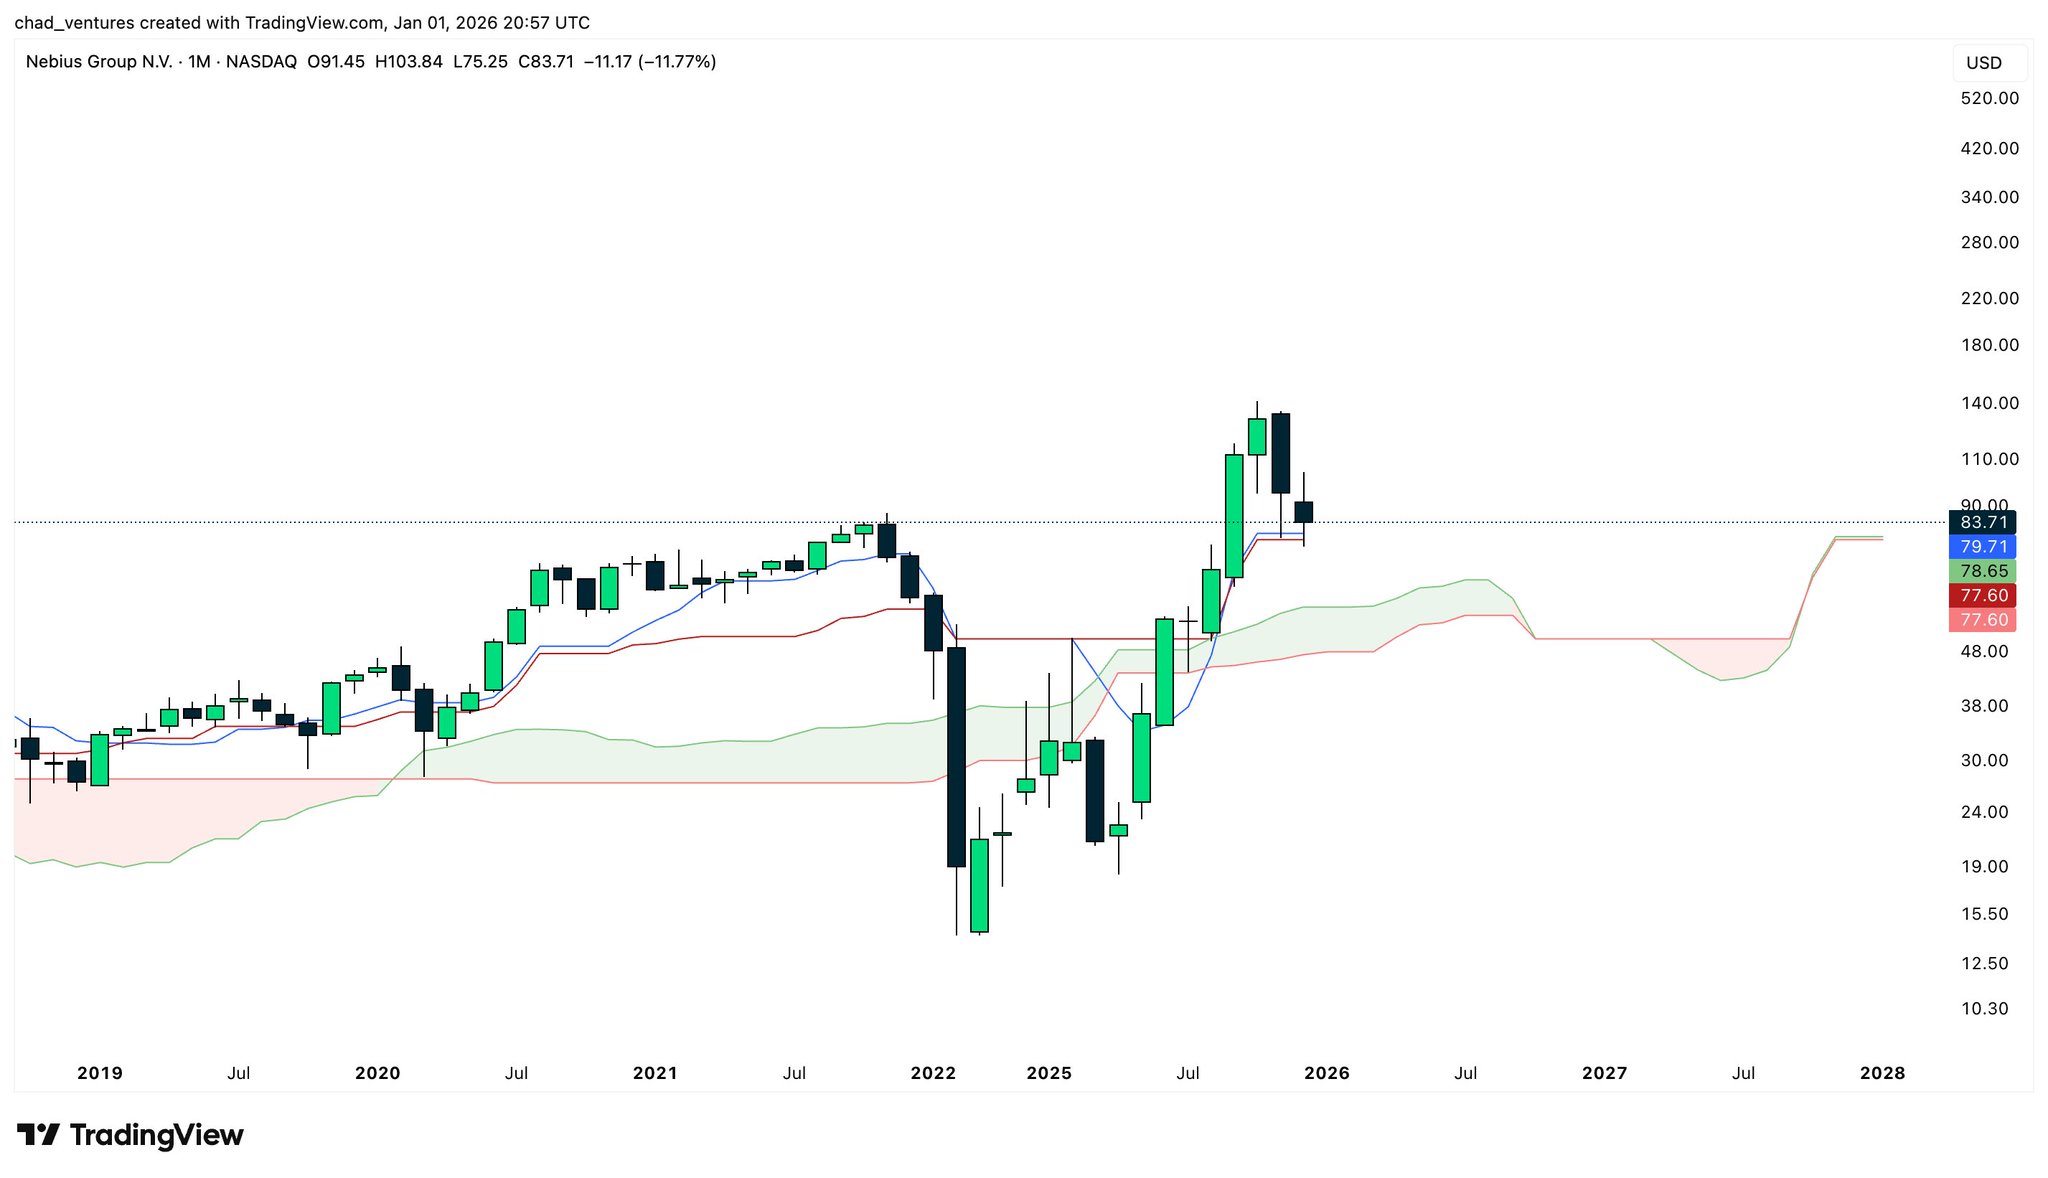
21.3K @chad_ventures 매우 강세
NBIS 주가가 양호하게 움직이고 있으며, 월간 지지를 지속적으로 지키고 있어 더 높은 저점 형성이 기대됩니다.
$NBIS의 저가가 1월에 약 $80 수준으로 꽤 괜찮게 유지되었습니다.
가격이 전체 상승 추세 동안 월간 Tenkan + Kijun을 유지했습니다! https://t.co/lSF7obdzIn
chad.
기술 분석가
트레이더
B
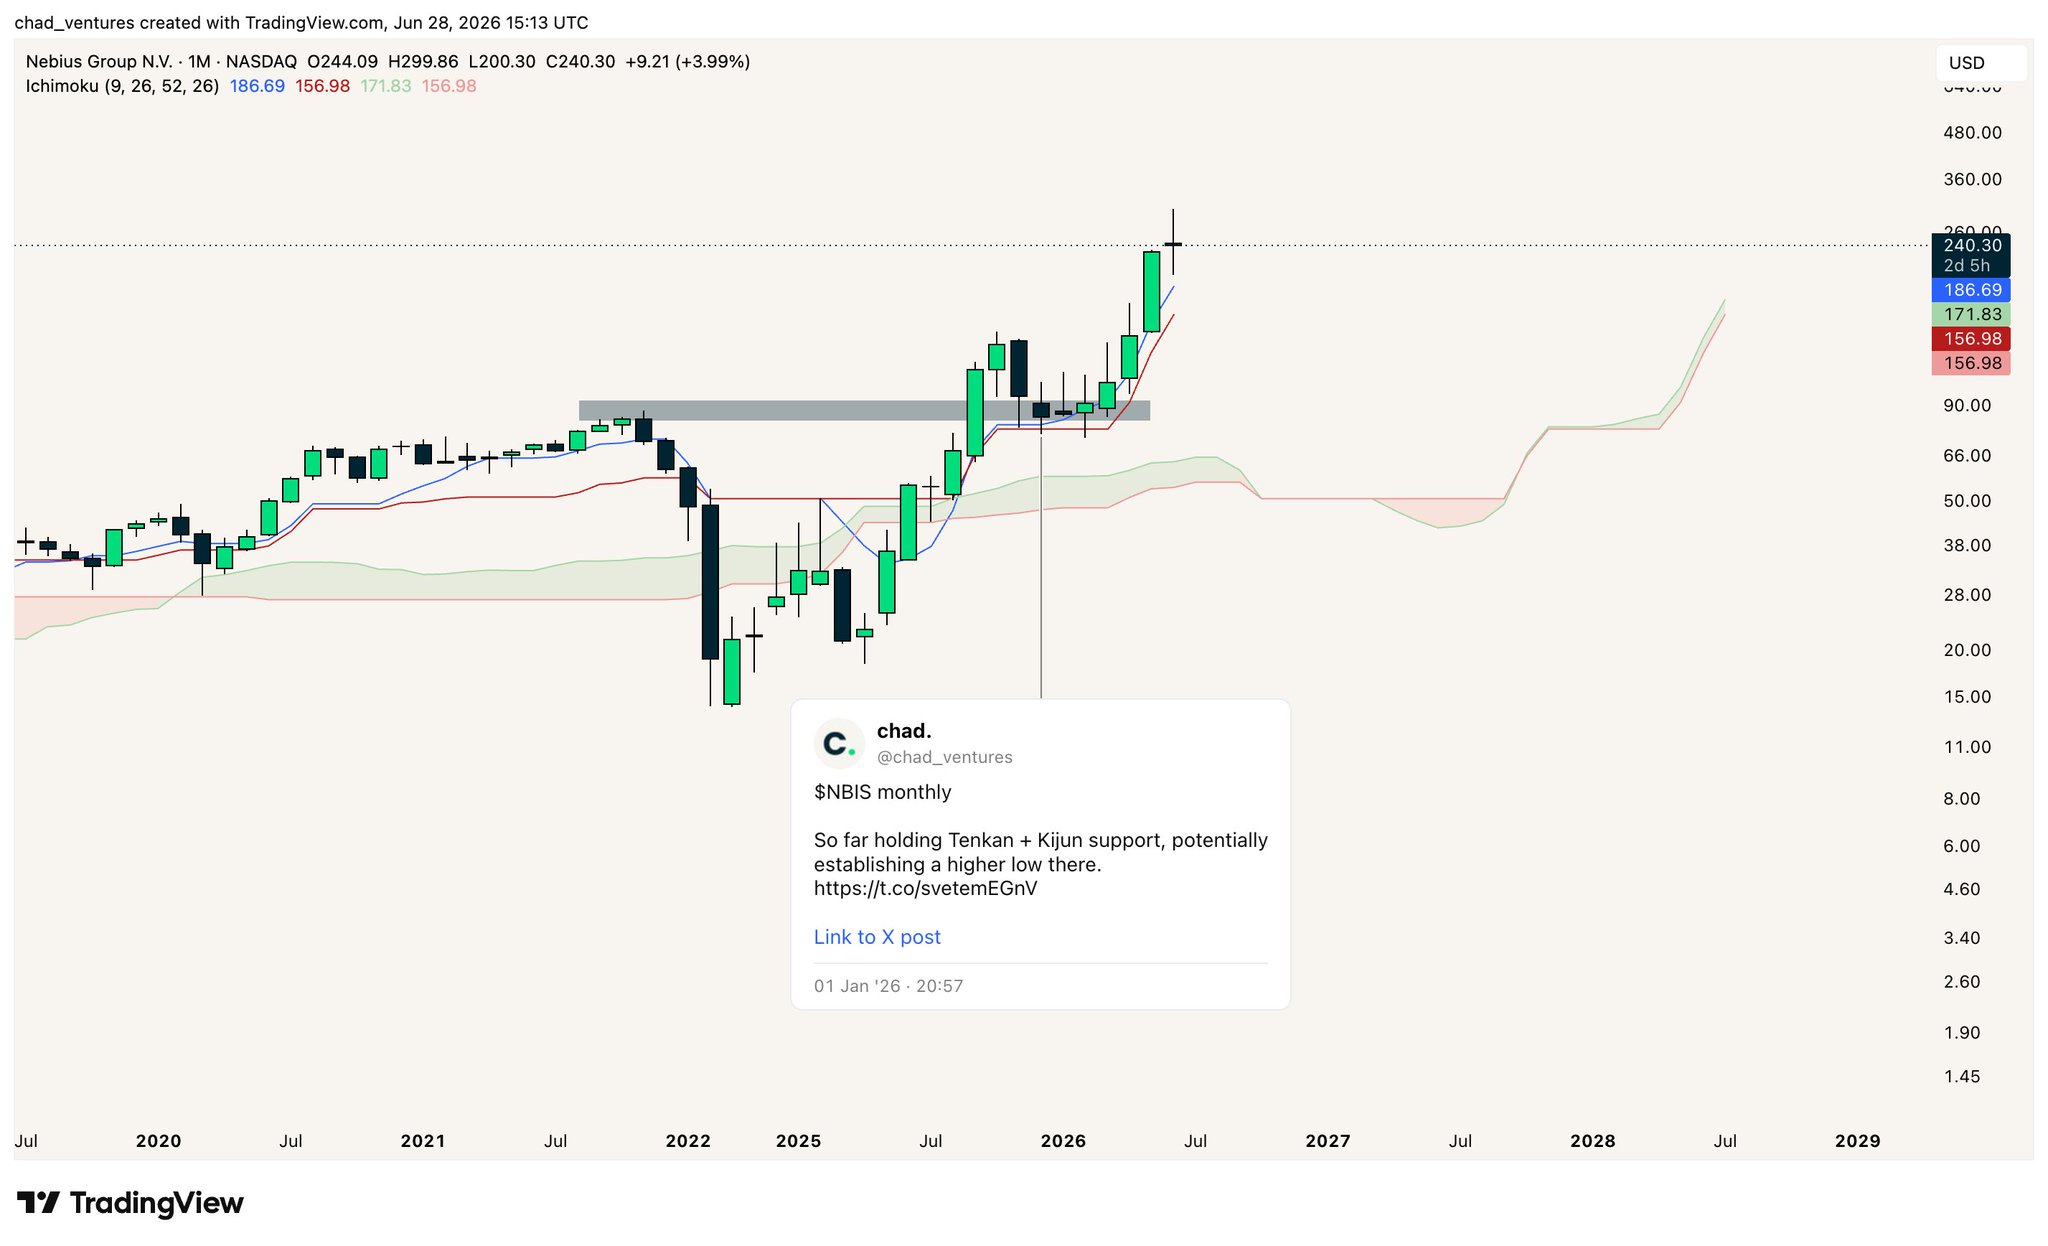
21.3K @chad_ventures $NBIS 월간
현재까지 Tenkan + Kijun 지지를 유지하고 있으며, 여기서 더 높은 저점을 형성할 가능성이 있습니다. https://t.co/svetemEGnV
 26
2
5.5K
26
2
5.5K
2026-06-28 15:17
NBIS의 출시 후 추세
매우 강세
NBIS 주가가 양호하게 움직이고 있으며, 월간 지지를 지속적으로 지키고 있어 더 높은 저점 형성이 기대됩니다.

Don’t Follow Shardi B If You Hate Money
트레이더
기술 분석가
C
251.3K @ShardiB2 상승세
NBIS 평가가 낮으며, 2026‑27년에 수요 급증이 예상되어 매수 권장
Chad 포트폴리오

MarketMaverick D
2.8K @MktMavPro $NBIS @leopoldasch 상황 인식 프레임워크는 2026‑2027년경에 컴퓨팅 수요가 수직으로 증가하는 변곡점이 있을 것으로 예측합니다. 이 일정에 동의한다면, @nebiusai 현재 평가가 2027‑28년 수치에 비해 저렴해 보입니다. 그는 2028년 Nebius를 할인된 가격에 매입하고 있습니다.
그가 보유한 포지션 규모만으로도 시장이 AGI 워크로드가 발생할 때 새로운 클라우드 수익이 어떻게 보이는지에 대해 아직 한 사이클 뒤처져 있다는 확신을 보여줍니다.
요약하면; 당신이 가는 방향을 보라, 현재 밟고 있는 곳을 보지 말라. 아직 보지 못한 것이 있다… 준비하십시오.
50
12
29.5K
2026-06-27 16:17
NBIS의 출시 후 추세
상승세
NBIS 평가가 낮으며, 2026‑27년에 수요 급증이 예상되어 매수 권장
가격 예측
When is a good time to buy NBIS? Should I buy or sell NBIS now?
When deciding whether it’s a good time to buy or sell Nebius Group NV (Derivatives) (NBIS), it’s important to first align with your own trading strategy and risk profile.Long-term investors and short-term traders often interpret market conditions differently, so your decision should reflect your personal approach. According to the latest NBIS 4-hour technical analysis, the current trading signal is Hold.

Beacon Prediction
Probabilistic Price Forecast (Next 24 Hours)Beacon Prediction Disclaimer
The data results displayed on this page are analyzed based on actual trading data (OHLCV) of the selected trading pair along with corresponding technical indicators.
This prediction is an experimental technical product and is provided for reference purposes only. It does not constitute investment advice. Unexpected real-world events may significantly impact market behavior. Traders should make decisions with caution.
This prediction is an experimental technical product and is provided for reference purposes only. It does not constitute investment advice. Unexpected real-world events may significantly impact market behavior. Traders should make decisions with caution.
소개 Nebius Group NV (Derivatives)
Nebius Group NV (Derivatives) (NBIS) is a cryptocurrency . Nebius Group NV (Derivatives) has a current supply of 0. The last known price of Nebius Group NV (Derivatives) is 242.74101312 USD and is up 0.99 over the last 24 hours. It is currently trading on 43 active market(s) with $0.00 traded over the last 24 hours.
자세히 읽어보기
Explore More
BM 디스커버리


새 리스팅

CIFRON Cipher Mining Inc.
-- 0.00%

WULFON TeraWulf Inc.
-- 0.00%

PINSON Pinterest, Inc.
-- 0.00%

HPEON Hewlett Packard Enterprise Co
-- 0.00%

PCGON PG&E
-- 0.00%

SOXLON Direxion Daily Semi Bull 3X ETF
-- 0.00%

NIOON NIO
-- 0.00%

HYGON iBoxx $ High Yield Corporate Bond ETF
-- 0.00%

AURON Aurora Innovation
-- 0.00%

IGVON iShares Expanded Tech-Software ETF
-- 0.00%