$ZAMA 차트가 $CFG 차트를 떠올리게 합니다. https://t.co/76IAiLkpYS


 3.2K @KubrickShining
 $ZAMA 차트가 $CFG 차트를 떠올리게 합니다. https://t.co/76IAiLkpYS
 0
0
 0
0
 149
3.2K @KubrickShining
149
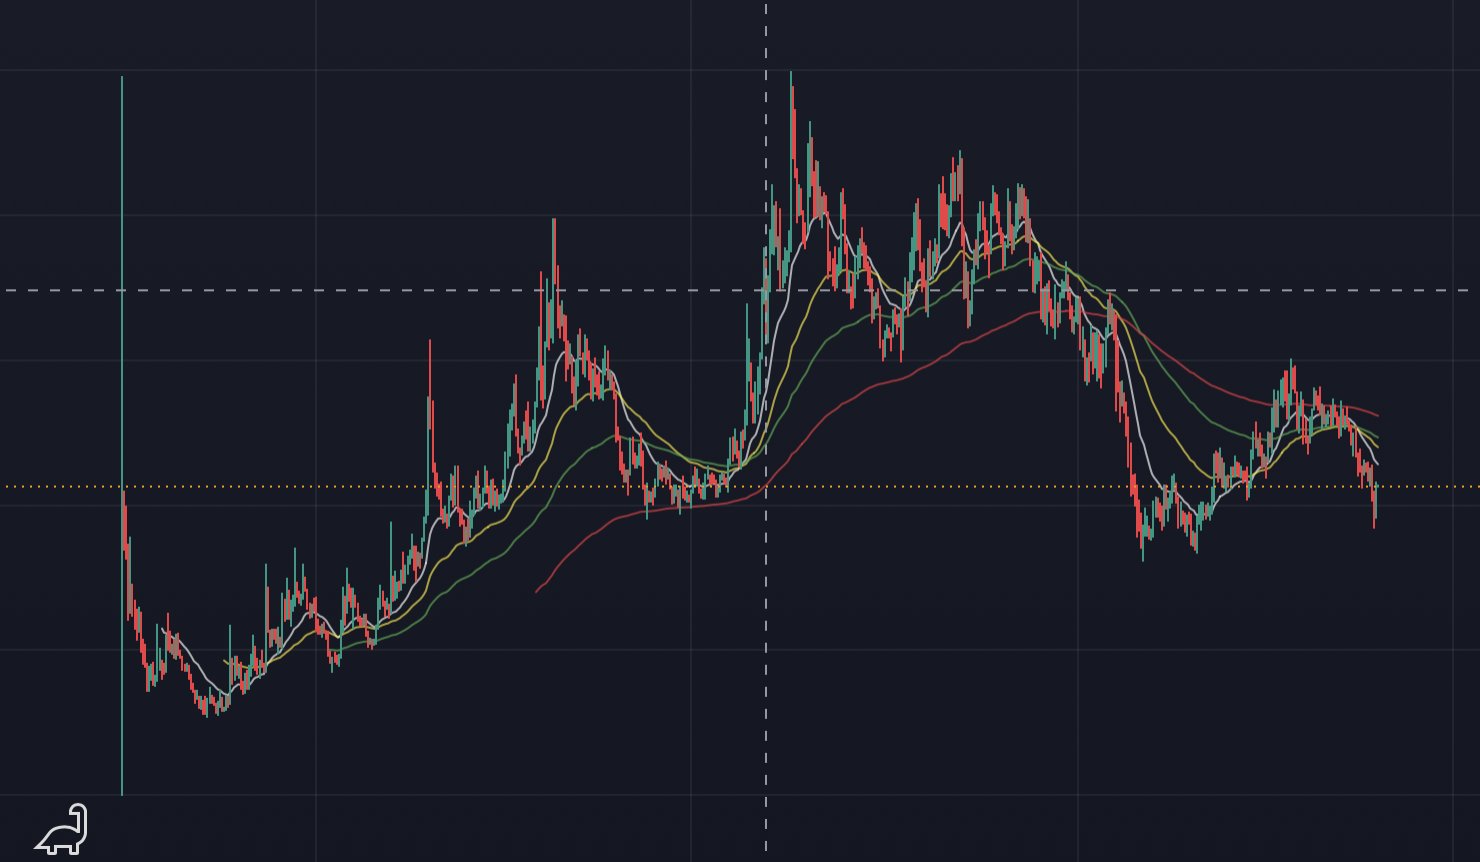
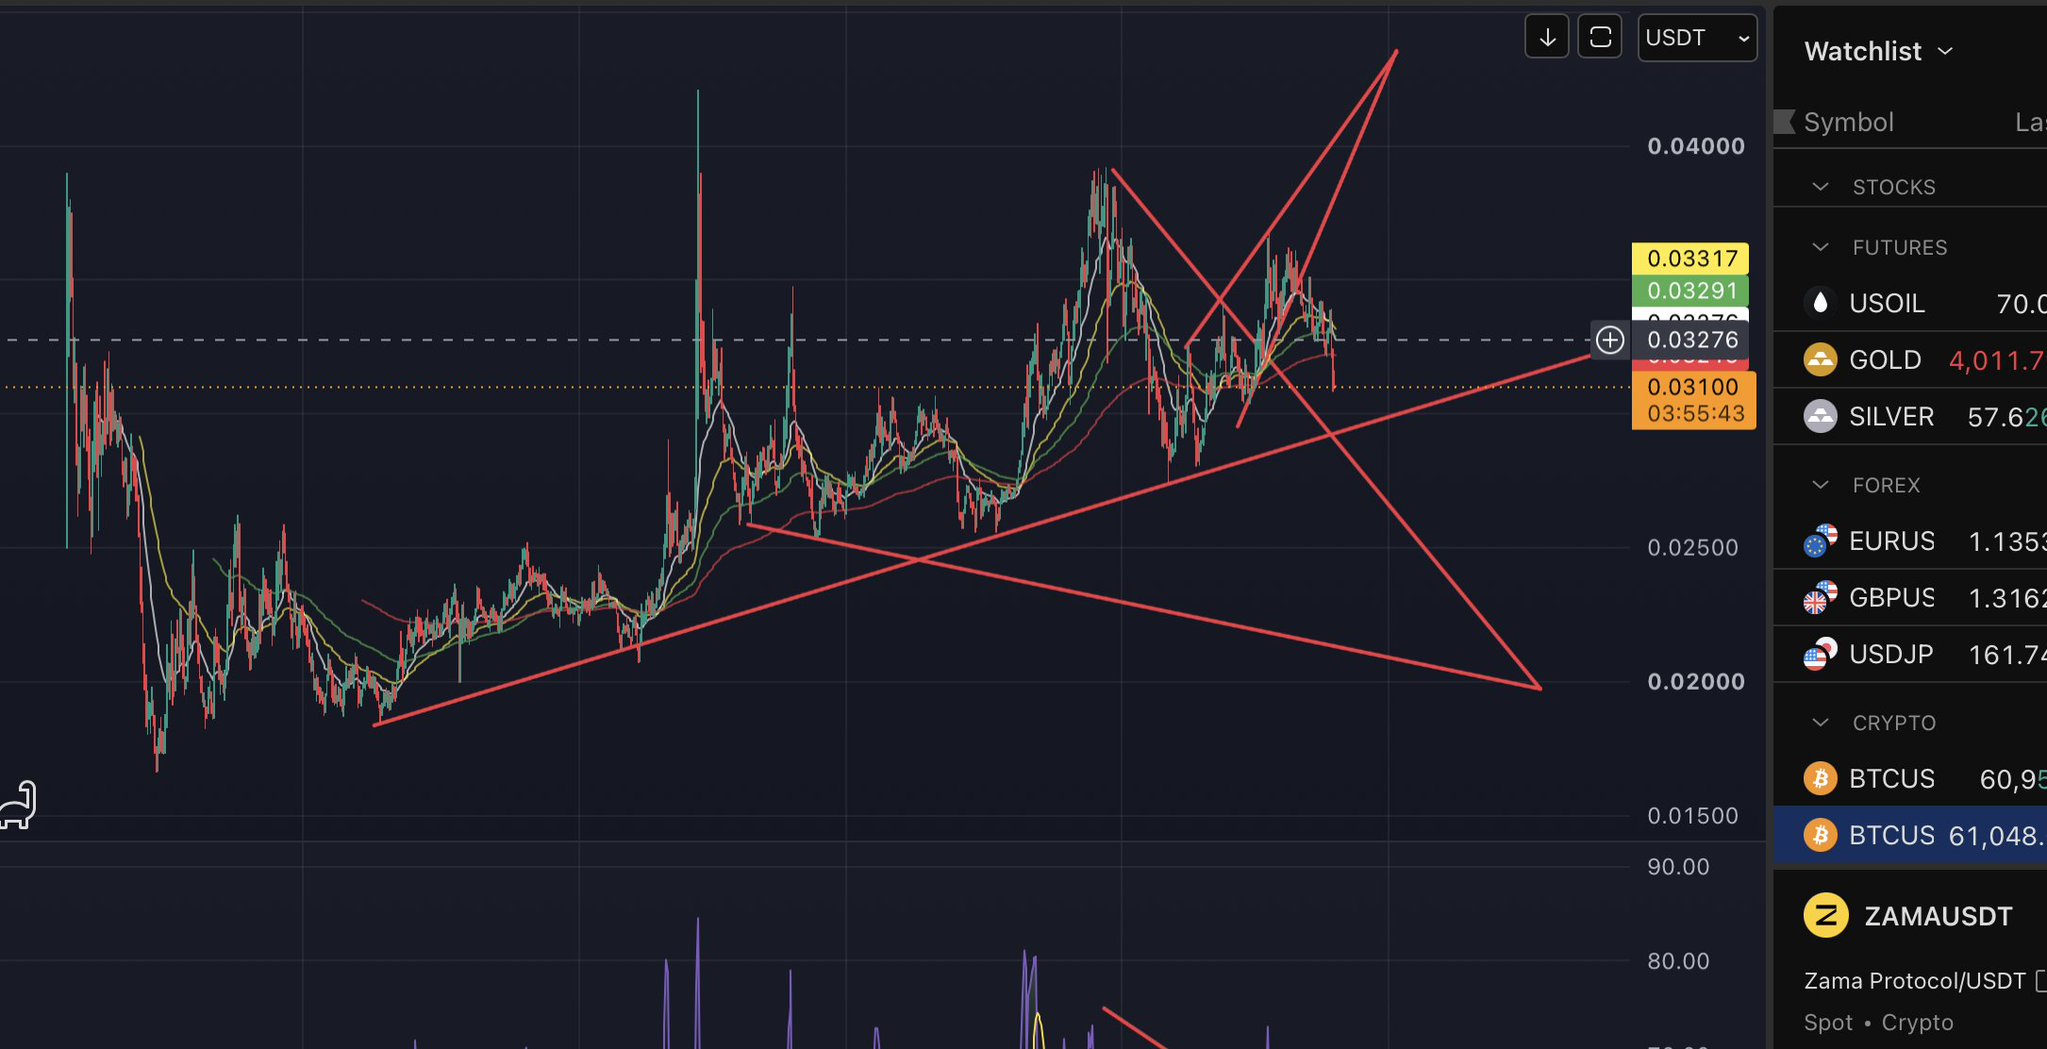
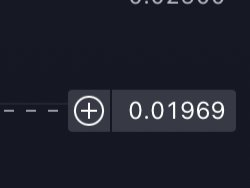
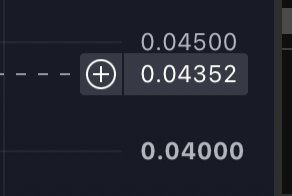
3.2K @KubrickShining $ZAMA 업데이트: 약간 상승 전망이지만, 이 하한 목표가 없었다면 더 상승했을 것 같습니다. 차트에 RSI 하강 웨지가 있습니다. 여전히 상승을 이어갈 수 있다고 생각되는 두 가지 요소를 보았습니다. 상한 목표는 0.043이고 하한은 0.019입니다. 하한은 주간 차트에서 꽤 명확합니다. 일일 차트에 큰 매도 신호가 있습니다. 2시간과 30분 차트에서 상승 발산이 보입니다.
7월 2일에 잠금이 해제됩니다. 약 100만 개 이상의 코인이 유통될 예정입니다. 이것이 또 다른 $Based 스타일 상장인지 궁금합니다. 수익을 기다리거나 더 낮은 가격에 매수해야 하는지요. 저는 이미 보유하고 있으며, 다음 상승장에서 이 개념이 좋은 성과를 낼 것이라 생각합니다. 하한 목표에서 다시 매수할 예정입니다. 그러나 입장 가격에 도달하지 않으면 다시 매수하지 않을 것입니다.
 0
0
452
0
0
452
 262.2K @AltcoinSherpa
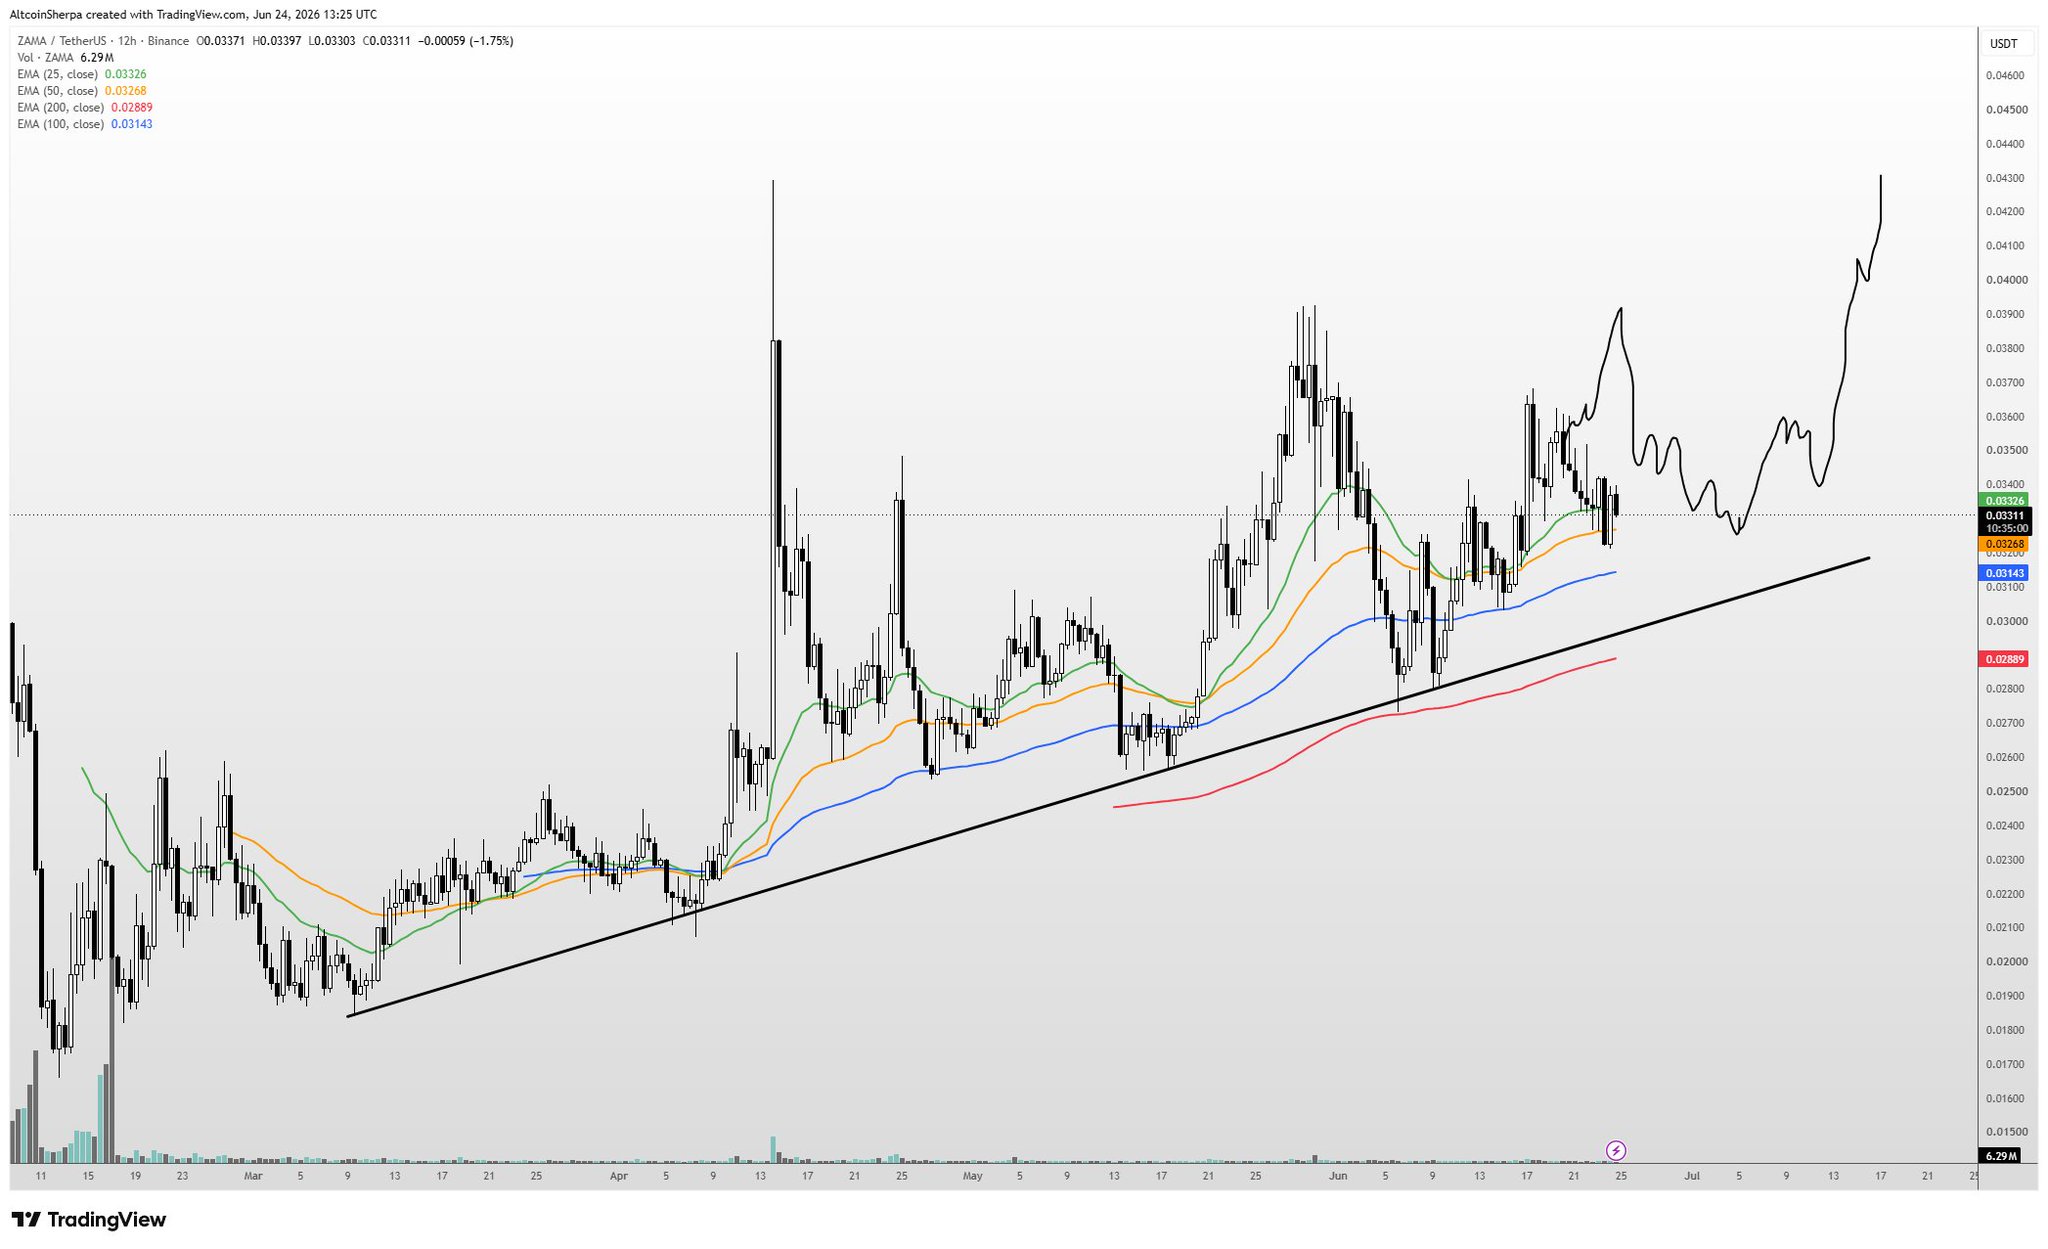
 $ZAMA 그들의 비밀 금고가 활성화된 것처럼 보이며, ZAMA는 프라이버시와 DeFi의 교차점입니다. 가격이 상대적으로 꽤 견고하게 유지되고 있으며, 저는 여전히 추세선을 따를 것으로 기대합니다. 최근 강세 코인 https://t.co/dj1VZkFjIc
 2 @AC626_
 @AltcoinSherpa $ZAMA 부탁합니다
9
2
9.9K