Bắt đầu
Quét để tải ứng dụng
iOS & Android

OLAXBT (AIO)

$
$ 0.059 (AIO/USD)
20.00%
24H

OLAXBT Dữ liệu giá trực tiếp

Giá OLAXBT hôm nay là $ 0.059 (AIO/USD). Với vốn hóa thị trường là $ 13.80M USD. Khối lượng giao dịch 24 giờ là $ 5.40M USD, Biến động giá trong 24 giờ là +20.00%, Và lượng cung lưu hành là 230.25M AIO.

OLAXBT AIO Lịch sử giá USD

Theo dõi giá của OLAXBT hôm nay, 7 ngày, 30 ngày và 90 ngày
Kỳ
Thay đổi
Biến động (%)
Hôm nay
$ 0.0099
20.00%
7ngày
$ 0.0099
25.00%
30ngày
$ 0.049
-50.00%
90ngày
$ 0.049
-50.00%

Sở hữu AIO ngay

Mua và bán AIO dễ dàng và an toàn trên BitMart.
Mua/Bán AIO ngay bây giờ
Mua/Bán {0} ngay bây giờ
OLAXBT Thông tin thị trường
Giá mới nhất $ 0.059
$ 0.049 Biến động 24 giờ $ 0.059
Cao nhất từng ghi nhận
‎$ 0.22‎
Thấp nhất từng ghi nhận
‎$ 0.029‎
Biến động 24 giờ
‎20.00%‎
Khối lượng 24 giờ
‎$ 5,396,260.06‎
Nguồn cung lưu hành
230.25M AIO
Vốn hóa thị trường
‎$ 13.80M‎
Nguồn cung tối đa
1.00B AIO
Vốn hóa thị trường đã pha loãng hoàn toàn
‎$ 59.94M‎
Giao dịch AIO

Kiếm tiền

Hãy đưa tiền mã hóa nhàn rỗi của bạn vào hoạt động và earn thu nhập thụ động thông qua tiết kiệm, staking và hơn thế nữa.
Thử ngay
Thử ngay

OLAXBT X Insight

avatar
Provides a detailed introduction to a day‑trading short‑term strategy that exploits a cryptocurrency's downtrend.

If you trade crypto, and especially looking for scalps/ day trade position, try this method. I made more money that I could imagine using this:

CRYPTO DAY TRADING TUTORIAL: FOLLOW THE TREND (BEARISH Version)

Yesterday I wrote about the bullish version of the follow the trend method, this time let's talk about the bearish version!
This method takes advantage of the follow the trend principle.

My principle:
1. What's falling will keep falling until reversal signs appear.
2. In crypto, the system is "once the momentum fades off, the asset will be abandoned dumping the price for a long period of time". So something that rose hundreds of percent a few days ago could start dropping today and be down 80% by tomorrow (try looking at the LAB few weeks ago, for example).

That's why we take advantage when something's just finished rising, then it looks like it's about to drop, we join in on the slide down.

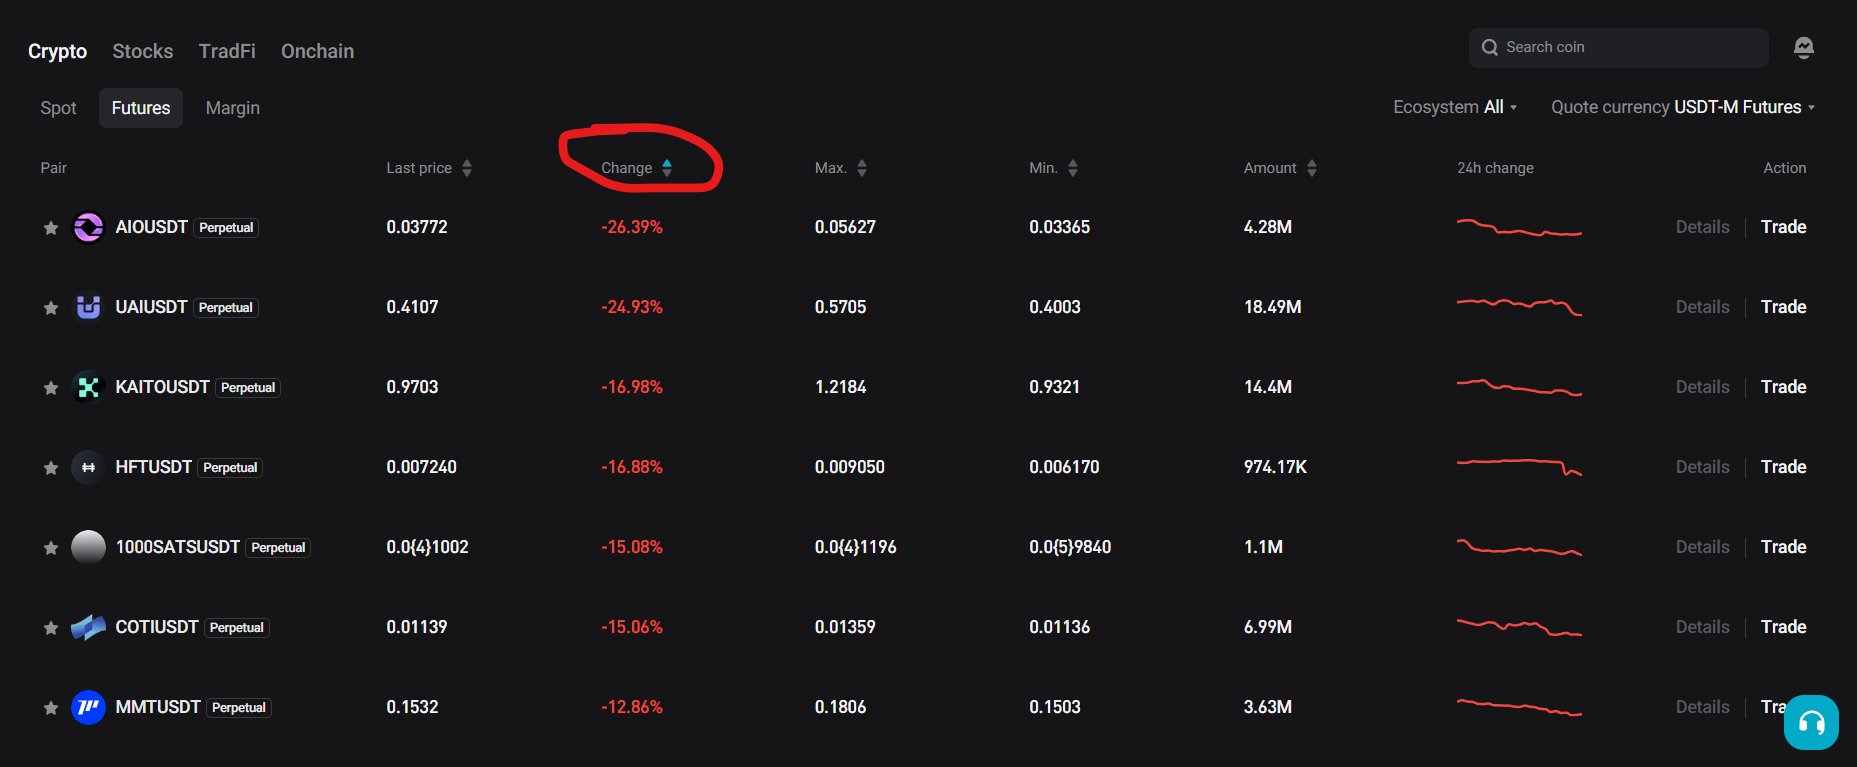
Step 1: Market Screening.
Go to Coinmarketcap, or to your favorite exchange. Sort by 24H% or top losers. Make sure we get the ones with big losses. You can do this by clicking on the 24H% or %Gains depending on the exchange, until it sorts from the lowest (see image 1). Examples in the image include AIO, UAI, KAITO, etc.

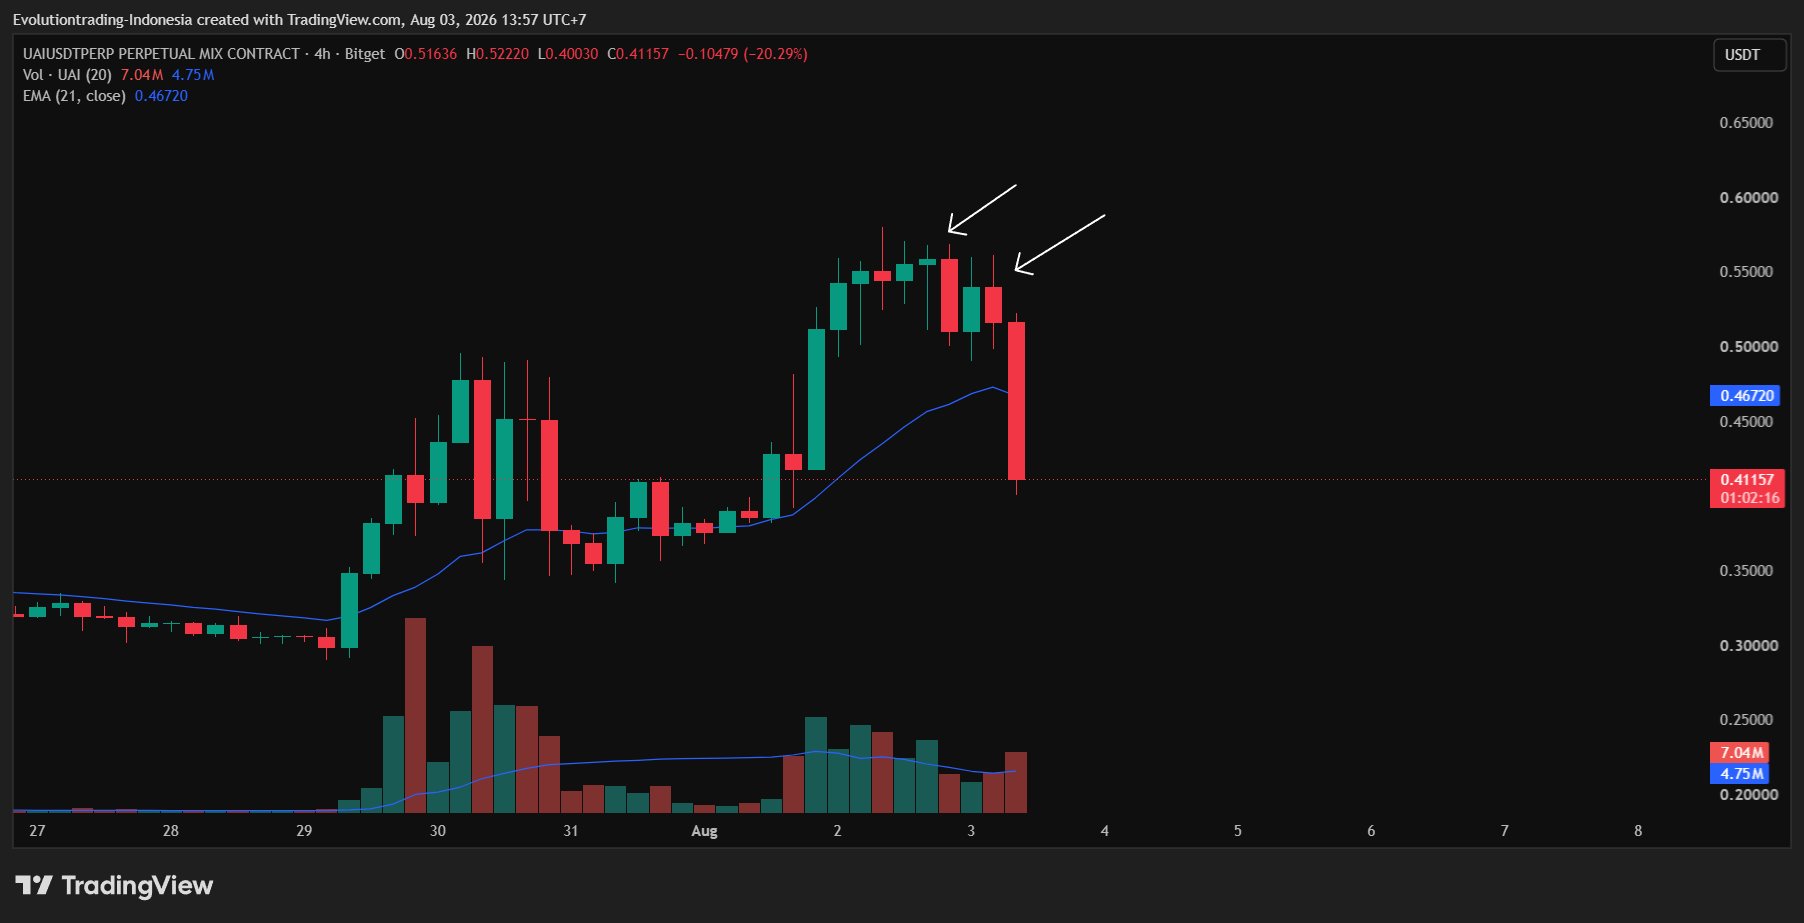
Step 2: Confirm the bias is bearish.
Open TradingView (or the exchange you're using, on its chart). Go to the 1‑day or 4‑hour timeframe first. Make sure:
- The chart is bearish (red) and
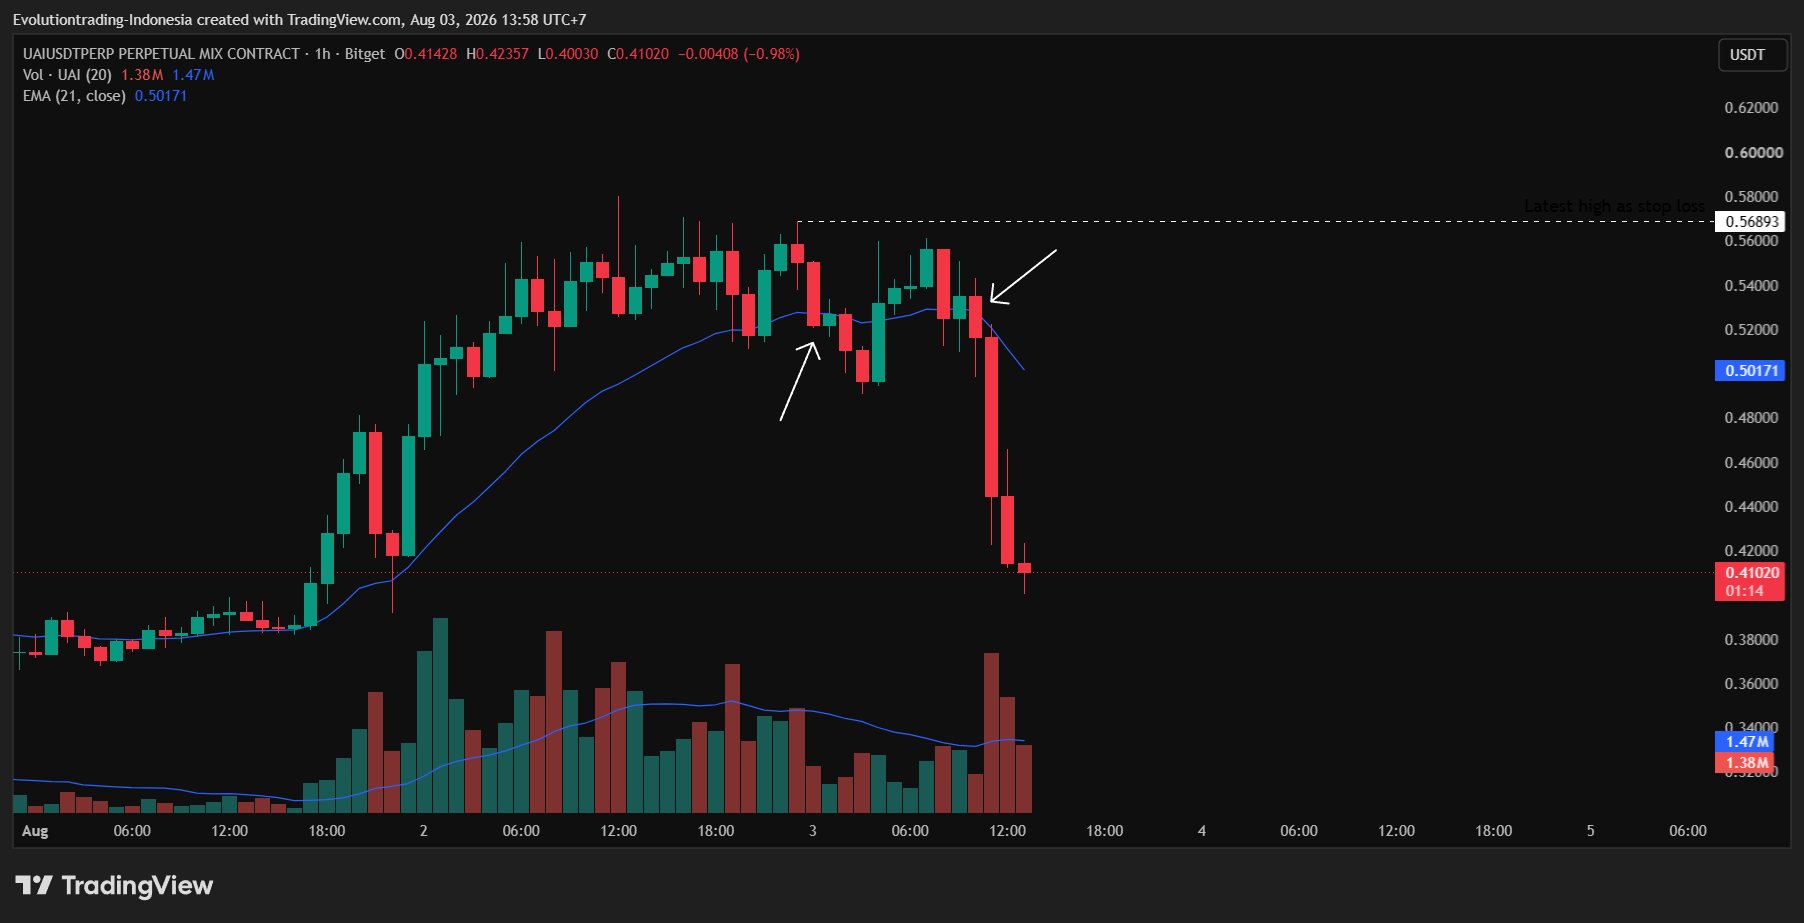
- Breakdown from key levels and/or 21 EMA. For the bearish version, big candles are still "okay" to trade. As long as you can handle the loss or patiently wait for a small pullback to find an optimal entry (see example in image 2, marked by arrows).

You can check several charts for this. Just mark the ones that meet the criteria, then move to step 3.

Step 3: Entry Trigger.
For now, we're specifically looking for short positions.
There are many ways, I'll cover them another time. But this time, let's use the 21 EMA on the 15‑minute or 1‑hour timeframe as resistance/support for entry.
We're looking for/waiting for a 15‑minute or 1‑hour candle to form a pattern with these conditions:
- Solid red body that's large with little or no lower wick, breaking through the 21 EMA on the 15‑minute timeframe
- Not a drop that's too big
- Even better if it previously broke out above the EMA, then failed by dropping to form a bearish candle.

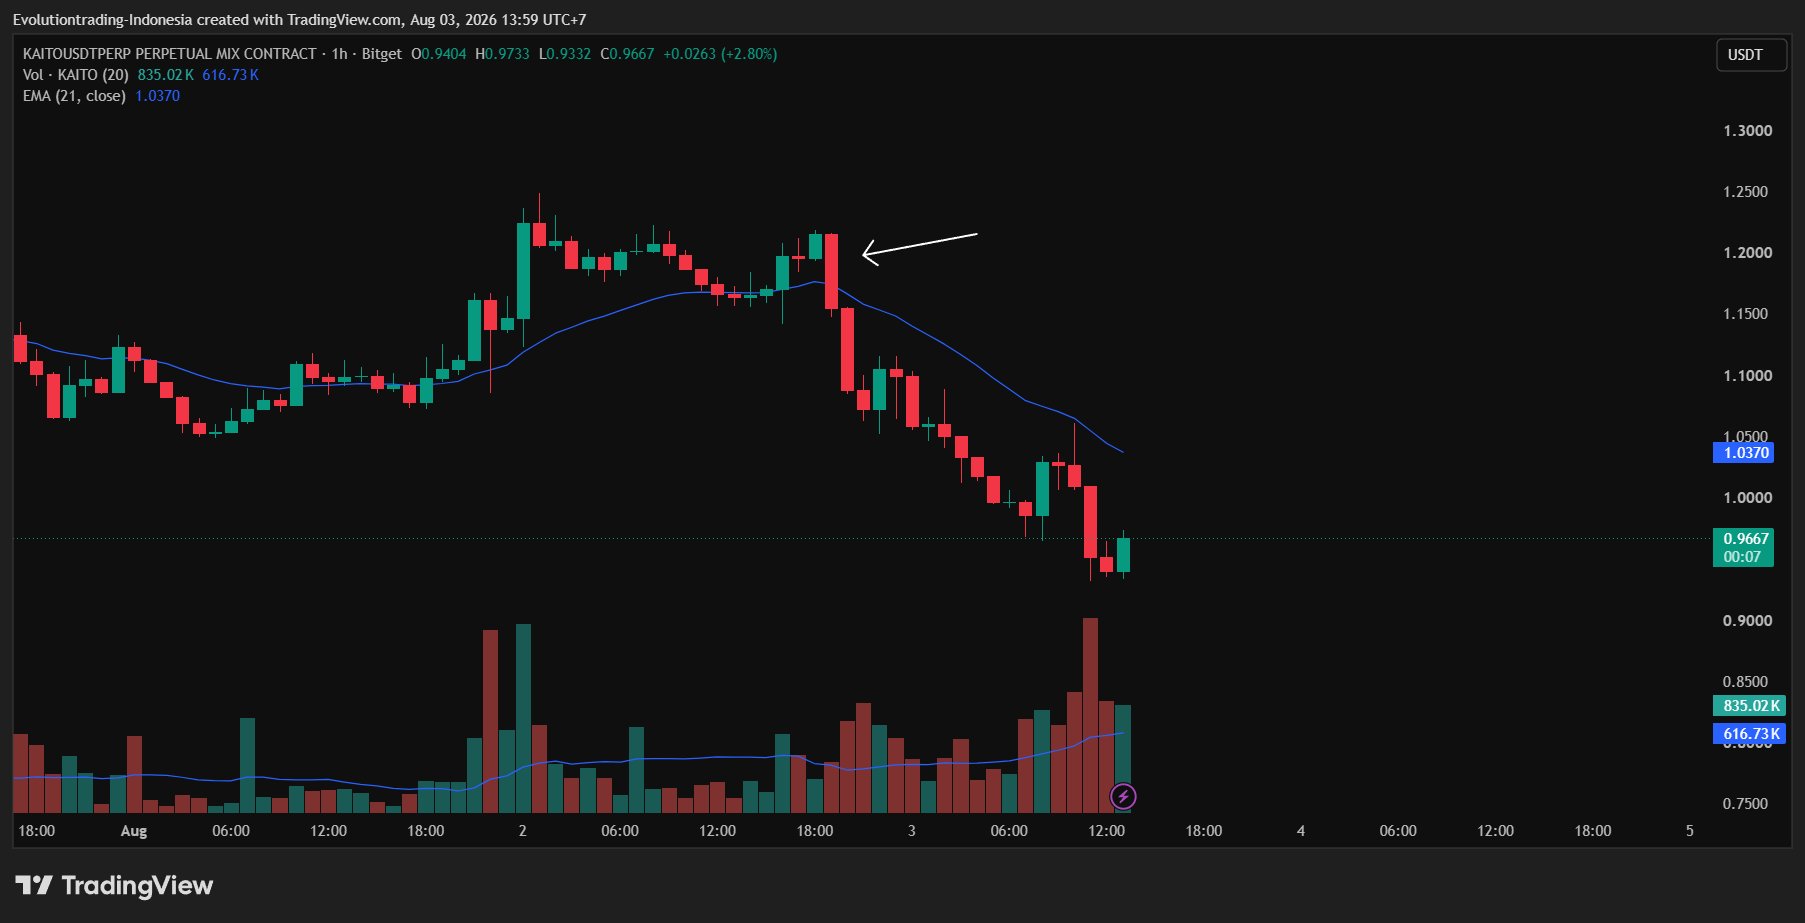
Check out arrows at image 3 and more example at image 4.

Step 4: Stop Loss, Take Profit, and Risk Management.
Place stop loss above the part of the candle that came out of the 21 EMA.
Take profit: Can aim for 2R first. But from my experience, crypto drops usually happen super fast. Can reach 4R or even 5R. But don't get greedy. 2R is enough in my opinion. The rest can be trailed.

Since this is day trading, and you can open many charts and enter several assets at once, just risk 0.5%‑1% per entry. And maximum total exposure to risk is 5%. Example: trade with 1% risk and hold 3 trade positions, then you're exposed to 3%.

Okay, go ahead and backtest it first. Or just front‑test it for a week.

Some limitations of this method:
- Sometimes we don't know if the crypto has truly crashed, or if it's just a correction. If it's just a correction on a larger timeframe, it could rise again even faster.
- Usually the current top losers have super volatile moves. Even 5x leverage can lead to liquidation. Make sure to calculate the risk properly.
view 4
view 1
view 1.4K
2026-08-03 14:12
Xu hướng của AIO sau khi phát hành
Tăng giá
Provides a detailed introduction to a day‑trading short‑term strategy that exploits a cryptocurrency's downtrend.
avatar
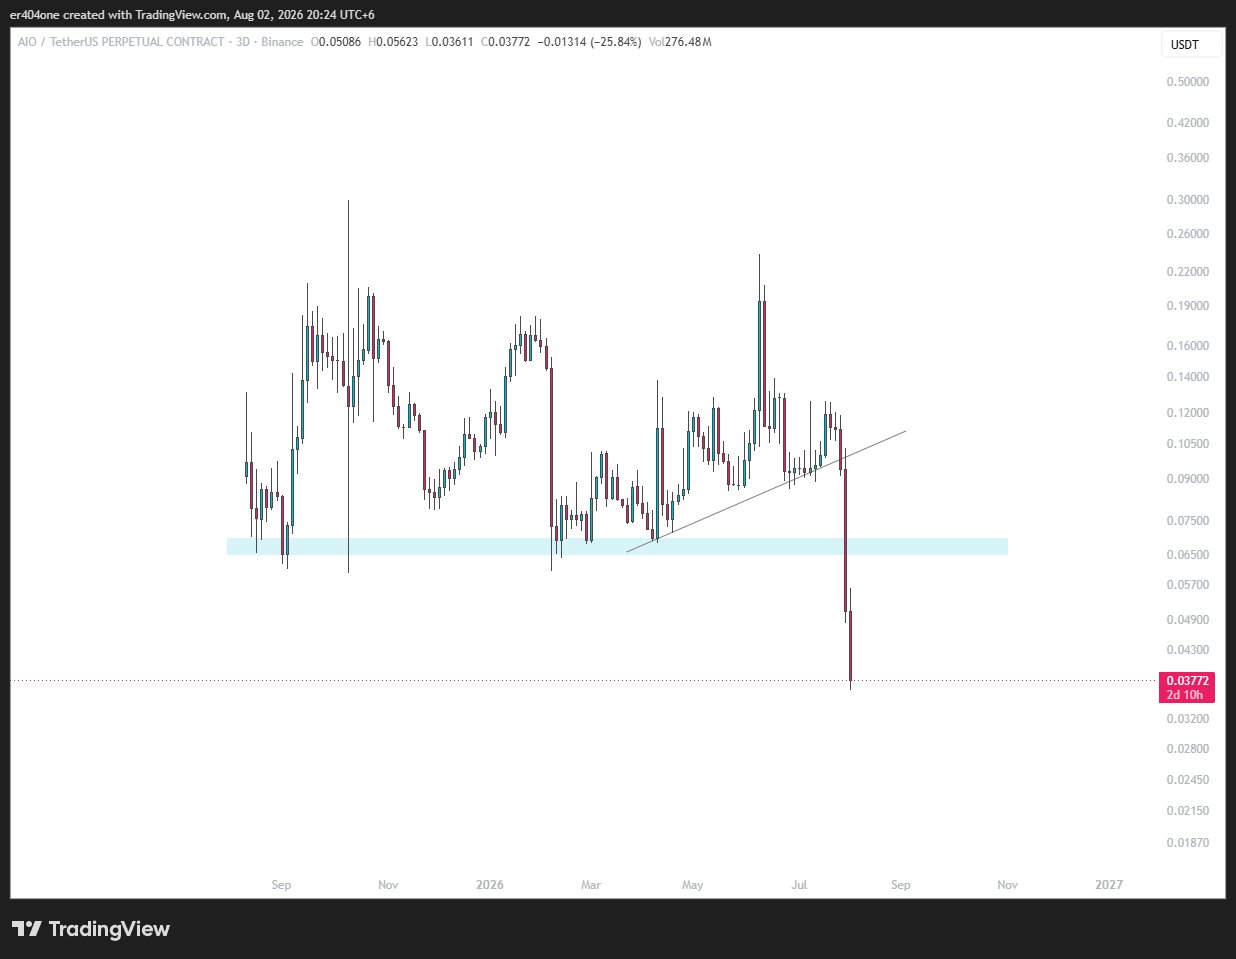
AIO is being called a scam, price plummets, breaking support.

Another scam dying so fast $AIO https://t.co/FZuvrw4Dpe

view 33
view 0
view 3.8K
2026-08-02 14:27
Xu hướng của AIO sau khi phát hành
Cực kỳ bi quan
AIO is being called a scam, price plummets, breaking support.
avatar
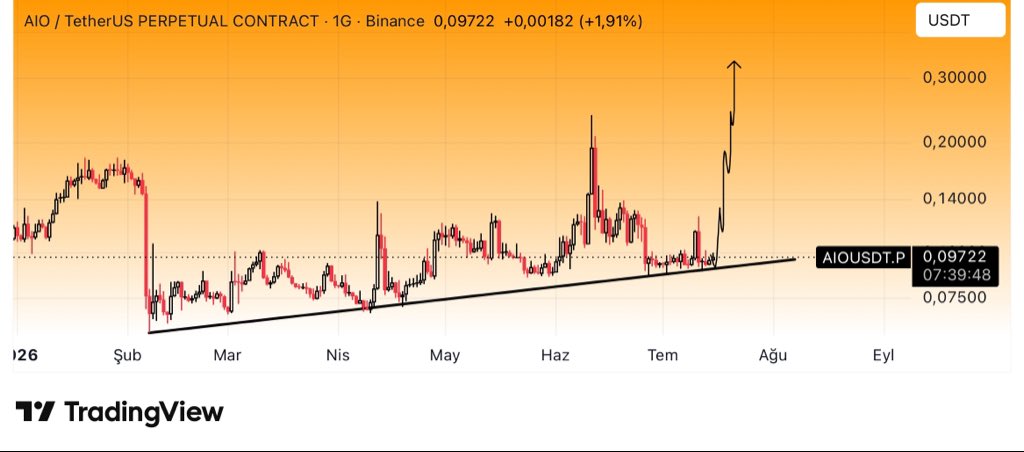
AIO has risen 20% along the expected path, and the chart shows a strong upward trend.

#AIOUSDT $AIO #Binance

So far, the chart has followed the projected path and delivered a 20% gain.

I’m continuing to monitor it closely.

avatar

#AIOUSDT $AIO #Bitcoin

#VELVET = #AIO

$AIO = 5/10 x ⏳⏳⏳⏳ https://t.co/Yil19Q2MEE

view 59
view 6
view 8.1K
2026-07-20 13:17
Xu hướng của AIO sau khi phát hành
Tăng giá
AIO has risen 20% along the expected path, and the chart shows a strong upward trend.
Chi tiết

Dự đoán giá

Thời điểm phù hợp để mua AIO là khi nào? Liệu tôi nên mua hay bán AIO bây giờ?

Khi quyết định xem đây có phải là thời điểm tốt để mua hoặc bán OLAXBT (AIO) hay không, điều quan trọng trước tiên là phải phù hợp với chiến lược giao dịch và mức độ chấp nhận rủi ro của riêng bạn. Các nhà đầu tư dài hạn và các nhà giao dịch ngắn hạn thường diễn giải điều kiện thị trường theo các cách khác nhau, vì vậy quyết định của bạn nên phản ánh cách tiếp cận cá nhân. Theo phân tích kỹ thuật 4 giờ mới nhất của AIO, tín hiệu giao dịch hiện tại là Bán. Theo phân tích kỹ thuật 1 ngày mới nhất của AIO, tín hiệu hiện tại là Hold.
23
Bán
Phân tích kỹ thuật 4 giờ về AIO
Lần cập nhật gần nhất 2026-08-15 19:59:59
50
Hold
Phân tích kỹ thuật 1 ngày về AIO
Lần cập nhật gần nhất 2026-08-14 23:59:59
beacon

Dự đoán Beacon

Dự báo giá xác suất cho (24 giờ tới)
i
Tuyên bố miễn trừ trách nhiệm về dự đoán Beacon
Kết quả dữ liệu hiển thị trên trang này được phân tích dựa trên dữ liệu giao dịch thực tế (OHLCV) của cặp giao dịch đã chọn cùng với các chỉ báo kỹ thuật tương ứng.
Dự đoán này là một sản phẩm kỹ thuật thử nghiệm và chỉ được cung cấp để tham khảo. Đây không phải là lời khuyên đầu tư. Những sự kiện bất ngờ trong thế giới thực có thể tác động đáng kể đến hành vi thị trường. Các nhà giao dịch nên đưa ra quyết định một cách thận trọng.
Giới thiệu OLAXBT
OLAXBT (AIO) is a cryptocurrency launched in 2025and operates on the BNB Smart Chain (BEP20) platform. OLAXBT has a current supply of 1,000,000,000 with 230,250,000 in circulation. The last known price of OLAXBT is 0.04384222 USD and is up 2.13 over the last 24 hours. It is currently trading on 113 active market(s) with $2,714,306.32 traded over the last 24 hours. More information can be found at https://olaxbt.xyz.
Đọc thêm